## Line Chart: gemma-3-4b-it
### Overview
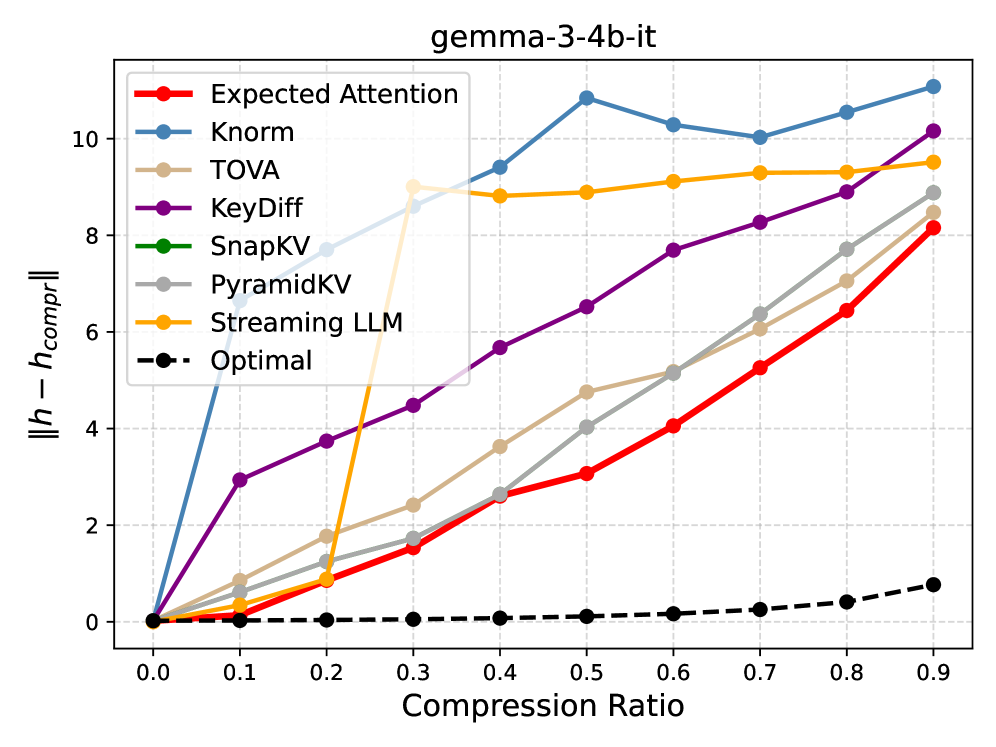
The chart visualizes the performance of various attention mechanisms and compression strategies for the "gemma-3-4b-it" model. The y-axis measures the difference between uncompressed and compressed model performance (||h - h_compr||), while the x-axis represents compression ratios from 0.0 to 0.9. Eight distinct methods are compared, with the "Optimal" strategy serving as a baseline.
### Components/Axes
- **X-axis**: Compression Ratio (0.0 to 0.9 in 0.1 increments)
- **Y-axis**: ||h - h_compr|| (0 to 10)
- **Legend**: Located in the upper-left corner, mapping colors to methods:
- Red: Expected Attention
- Blue: Knorm
- Beige: TOVA
- Purple: KeyDiff
- Green: SnapKV
- Gray: PyramidKV
- Orange: Streaming LLM
- Black dashed: Optimal
### Detailed Analysis
1. **Knorm (Blue)**:
- Starts at 0, spikes sharply to ~10.5 at 0.1 compression ratio
- Fluctuates between ~8.5 and 10.5 for ratios 0.2–0.9
- *Trend*: High sensitivity to compression, with persistent performance degradation
2. **Streaming LLM (Orange)**:
- Remains near 0 until 0.3 compression ratio
- Rises sharply to ~9 at 0.3, then plateaus
- *Trend*: Sudden degradation at mid-range compression, then stabilizes
3. **Expected Attention (Red)**:
- Gradual linear increase from 0 to ~8.5
- *Trend*: Consistent linear degradation with compression
4. **KeyDiff (Purple)**:
- Steeper linear increase than Expected Attention (~10 at 0.9)
- *Trend*: Linear degradation, slightly outperforming Expected Attention
5. **TOVA (Beige)**:
- Gradual increase from 0 to ~7.5
- *Trend*: Moderate linear degradation
6. **PyramidKV (Gray)**:
- Similar to TOVA but slightly higher (~8 at 0.9)
- *Trend*: Linear degradation with minor curvature
7. **SnapKV (Green)**:
- Remains near 0 throughout
- *Trend*: No measurable degradation
8. **Optimal (Black dashed)**:
- Consistently near 0
- *Trend*: Perfect baseline performance
### Key Observations
- **Knorm** exhibits the most dramatic performance drop, with a 10.5-unit deviation at 0.1 compression
- **SnapKV** and **Optimal** maintain near-zero deviation, suggesting superior compression efficiency
- **Streaming LLM** shows a unique pattern with abrupt degradation at 0.3 compression
- All methods except SnapKV and Optimal show >5 unit degradation at 0.9 compression
### Interpretation
The data demonstrates that most attention mechanisms suffer significant performance loss with compression, with Knorm being particularly vulnerable. SnapKV and Optimal strategies maintain near-original performance, indicating they preserve model integrity better during compression. The abrupt degradation in Streaming LLM at 0.3 compression suggests potential architectural limitations at this specific compression threshold. The linear trends in Expected Attention and KeyDiff imply predictable degradation patterns, while TOVA and PyramidKV show moderate resilience. The Optimal baseline's consistent performance highlights the ideal compression target for this model architecture.