## Diagram: State Transition Diagram
### Overview
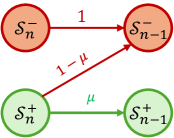
The image presents a state transition diagram illustrating transitions between two states, denoted as $S_n^-$ and $S_n^+$, and their subsequent states $S_{n-1}^-$ and $S_{n-1}^+$. The diagram shows the probabilities associated with each transition.
### Components/Axes
* **States:**
* $S_n^-$: Represented by a red circle.
* $S_n^+$: Represented by a green circle.
* $S_{n-1}^-$: Represented by a red circle.
* $S_{n-1}^+$: Represented by a green circle.
* **Transitions:**
* From $S_n^-$ to $S_{n-1}^-$: Labeled with probability "1" (red arrow).
* From $S_n^+$ to $S_{n-1}^-$: Labeled with probability "1 - μ" (red arrow).
* From $S_n^+$ to $S_{n-1}^+$: Labeled with probability "μ" (green arrow).
### Detailed Analysis
* The diagram shows that state $S_n^-$ transitions directly to state $S_{n-1}^-$ with a probability of 1.
* State $S_n^+$ can transition to either $S_{n-1}^-$ with probability $1 - \mu$ or to $S_{n-1}^+$ with probability $\mu$.
### Key Observations
* The transition from $S_n^-$ is deterministic, always leading to $S_{n-1}^-$.
* The transition from $S_n^+$ is probabilistic, branching to either $S_{n-1}^-$ or $S_{n-1}^+$ based on the value of $\mu$.
### Interpretation
The diagram models a system where the state $S_n^-$ always decrements to $S_{n-1}^-$. The state $S_n^+$ has two possible transitions: it can either decrement to $S_{n-1}^+$ with probability $\mu$, or it can transition to $S_{n-1}^-$ with probability $1 - \mu$. The parameter $\mu$ controls the likelihood of the system staying in the "+" state versus transitioning to the "-" state. This could represent a simplified model of a process where a state can either remain in a positive condition or revert to a negative condition, with $\mu$ representing the probability of remaining in the positive condition.