## Diagram: State Transition System with Probabilistic and Deterministic Flows
### Overview
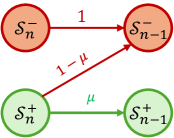
The diagram illustrates a state transition system with four nodes (two red, two green) and three directed edges. Red nodes represent states labeled with a superscript "-" (e.g., \( \mathcal{S}_n^- \)), while green nodes use a superscript "+" (e.g., \( \mathcal{S}_n^+ \)). Arrows indicate transitions between states, labeled with numerical values or expressions.
### Components/Axes
- **Nodes**:
- Top row: Red circles labeled \( \mathcal{S}_n^- \) (left) and \( \mathcal{S}_{n-1}^- \) (right).
- Bottom row: Green circles labeled \( \mathcal{S}_n^+ \) (left) and \( \mathcal{S}_{n-1}^+ \) (right).
- **Edges**:
1. **Red arrow (top)**: From \( \mathcal{S}_n^- \) to \( \mathcal{S}_{n-1}^- \), labeled "1".
2. **Green arrow (bottom)**: From \( \mathcal{S}_n^+ \) to \( \mathcal{S}_{n-1}^+ \), labeled "μ".
3. **Red arrow (diagonal)**: From \( \mathcal{S}_n^+ \) to \( \mathcal{S}_{n-1}^- \), labeled "1-μ".
### Detailed Analysis
- **Node Labels**:
- \( \mathcal{S}_n^- \), \( \mathcal{S}_{n-1}^- \): Red nodes, likely representing negative states at time steps \( n \) and \( n-1 \).
- \( \mathcal{S}_n^+ \), \( \mathcal{S}_{n-1}^+ \): Green nodes, likely representing positive states at time steps \( n \) and \( n-1 \).
- **Edge Labels**:
- "1": Deterministic transition (100% probability) from \( \mathcal{S}_n^- \) to \( \mathcal{S}_{n-1}^- \).
- "μ": Probabilistic transition (probability \( \mu \)) from \( \mathcal{S}_n^+ \) to \( \mathcal{S}_{n-1}^+ \).
- "1-μ": Complementary probability (\( 1-\mu \)) from \( \mathcal{S}_n^+ \) to \( \mathcal{S}_{n-1}^- \).
### Key Observations
1. **Deterministic Flow**: The red arrow labeled "1" ensures \( \mathcal{S}_n^- \) always transitions to \( \mathcal{S}_{n-1}^- \).
2. **Probabilistic Branching**: From \( \mathcal{S}_n^+ \), transitions split into two paths:
- \( \mu \)-probability to \( \mathcal{S}_{n-1}^+ \) (green arrow).
- \( 1-\mu \)-probability to \( \mathcal{S}_{n-1}^- \) (red arrow).
3. **Color Coding**: Red edges may represent negative/loss states, while green edges represent positive/gain states.
### Interpretation
This diagram likely models a **Markov chain** or **state-dependent system** with two states (\( n \) and \( n-1 \)) and two modes (+/-). The deterministic transition (\( \mathcal{S}_n^- \to \mathcal{S}_{n-1}^- \)) suggests a fixed decay or loss process for negative states. For positive states (\( \mathcal{S}_n^+ \)), transitions are probabilistic:
- A fraction \( \mu \) retains the positive state (\( \mathcal{S}_{n-1}^+ \)).
- A fraction \( 1-\mu \) transitions to the negative state (\( \mathcal{S}_{n-1}^- \)).
The system could represent phenomena like:
- **Economic models**: Positive states as profitable periods, negative as losses.
- **Biological systems**: Active (green) vs. dormant (red) states.
- **Technical systems**: Stable (green) vs. failure (red) states.
The absence of numerical values for \( \mu \) implies it is a parameter to be defined externally. The diagram emphasizes structural relationships over quantitative trends.