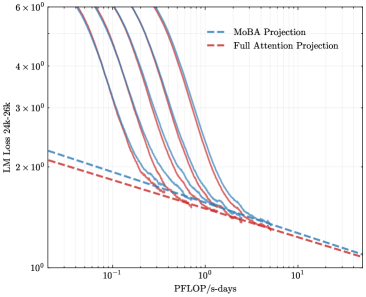
## Chart: LM Loss vs. PFLOP/s-days
### Overview
The image is a line chart comparing the Language Model (LM) Loss against the computational cost (PFLOP/s-days) for two different projection methods: MoBA Projection and Full Attention Projection. The chart displays multiple runs or configurations for each method, showing how the loss decreases as computational cost increases. The y-axis is LM Loss from 24k to 26k, and the x-axis is PFLOP/s-days. Both axes are on a logarithmic scale.
### Components/Axes
* **Title:** None visible in the image.
* **X-Axis:** PFLOP/s-days (PetaFLOPS per second-days). Logarithmic scale from approximately 0.1 to 10.
* Axis Markers: 10<sup>-1</sup>, 10<sup>0</sup>, 10<sup>1</sup>
* **Y-Axis:** LM Loss 24k-26k (Language Model Loss from 24,000 to 26,000). Logarithmic scale from approximately 1 to 6 x 10<sup>0</sup>.
* Axis Markers: 10<sup>0</sup>, 2 x 10<sup>0</sup>, 3 x 10<sup>0</sup>, 4 x 10<sup>0</sup>, 6 x 10<sup>0</sup>
* **Legend:** Located in the top-right corner.
* MoBA Projection (Blue dashed line)
* Full Attention Projection (Red dashed line)
### Detailed Analysis
* **MoBA Projection (Blue dashed line):** This line represents the performance of the MoBA Projection method. It starts at approximately (0.1, 2.2) and decreases to approximately (10, 1.2). The trend is a downward slope, indicating that as computational cost increases, the LM Loss decreases.
* **Full Attention Projection (Red dashed line):** This line represents the performance of the Full Attention Projection method. It starts at approximately (0.1, 2.4) and decreases to approximately (10, 1.1). The trend is a downward slope, indicating that as computational cost increases, the LM Loss decreases.
* **Multiple Runs (Solid Blue and Red Lines):** There are several solid blue and red lines, which likely represent different runs or configurations of the MoBA and Full Attention Projection methods, respectively. These lines show a steeper initial drop in LM Loss compared to the dashed lines.
* **Solid Blue Lines (MoBA):** These lines generally start at a higher LM Loss (around 6 x 10<sup>0</sup>) and decrease rapidly as PFLOP/s-days increases. They converge towards the dashed blue line as the computational cost increases.
* **Solid Red Lines (Full Attention):** These lines also start at a higher LM Loss (around 6 x 10<sup>0</sup>) and decrease rapidly as PFLOP/s-days increases. They converge towards the dashed red line as the computational cost increases.
* **Run 1 (leftmost):** Starts at approximately (0.05, 6.0).
* The blue line decreases to approximately (0.2, 2.0)
* The red line decreases to approximately (0.2, 2.0)
* **Run 2:** Starts at approximately (0.06, 6.0).
* The blue line decreases to approximately (0.3, 2.0)
* The red line decreases to approximately (0.3, 2.0)
* **Run 3:** Starts at approximately (0.08, 6.0).
* The blue line decreases to approximately (0.4, 2.0)
* The red line decreases to approximately (0.4, 2.0)
* **Run 4:** Starts at approximately (0.1, 6.0).
* The blue line decreases to approximately (0.5, 2.0)
* The red line decreases to approximately (0.5, 2.0)
### Key Observations
* Both MoBA and Full Attention Projection methods show a decrease in LM Loss as computational cost (PFLOP/s-days) increases.
* The solid lines, representing multiple runs, show a steeper initial decrease in LM Loss compared to the dashed lines.
* The solid lines converge towards the dashed lines as the computational cost increases, suggesting that the initial variability in performance decreases with more computation.
* At higher computational costs (larger PFLOP/s-days), the difference in LM Loss between MoBA and Full Attention Projection becomes smaller.
### Interpretation
The chart suggests that both MoBA and Full Attention Projection methods are effective in reducing LM Loss with increased computational resources. The multiple runs indicate that there might be some variability in the initial performance, but this variability decreases as the computational cost increases. The convergence of the solid lines towards the dashed lines suggests that the initial conditions or configurations have less impact on the final LM Loss when more computational resources are used. The dashed lines likely represent an average or baseline performance for each method. The fact that both methods converge to similar LM Loss values at higher computational costs indicates that their performance becomes comparable in that regime. The data suggests that the choice between MoBA and Full Attention Projection might depend on the specific computational budget and the desired level of initial performance variability.