## Chart: LM Loss vs. PFLOP/s-days
### Overview
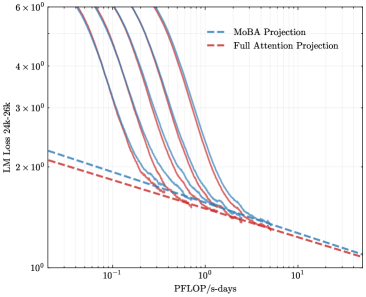
The image presents a line chart comparing the Language Model (LM) Loss of two projection methods – MoBA Projection and Full Attention Projection – against PFLOP/s-days (floating point operations per second per day). The chart displays multiple lines for each projection method, likely representing different runs or configurations. The y-axis is on a logarithmic scale.
### Components/Axes
* **X-axis:** PFLOP/s-days, ranging from approximately 10<sup>-2</sup> to 10<sup>1</sup> (0.01 to 10). The scale is logarithmic.
* **Y-axis:** LM Loss 24k-26k, ranging from approximately 10<sup>0</sup> to 6 x 10<sup>6</sup> (1 to 6,000,000). The scale is logarithmic.
* **Legend:** Located in the top-right corner.
* MoBA Projection (Blue dashed lines)
* Full Attention Projection (Red solid lines)
* **Gridlines:** Present on a logarithmic scale for both axes.
### Detailed Analysis
The chart contains multiple lines for each projection method. Let's analyze the trends and approximate data points:
**MoBA Projection (Blue dashed lines):**
* There are approximately 6 lines representing MoBA Projection.
* **Trend:** All MoBA lines generally slope downwards, indicating that as PFLOP/s-days increase, the LM Loss decreases. The slope is initially steep and then becomes less pronounced.
* **Data Points (approximate):**
* At PFLOP/s-days ≈ 0.01, LM Loss ranges from approximately 2 x 10<sup>3</sup> to 5 x 10<sup>3</sup>.
* At PFLOP/s-days ≈ 0.1, LM Loss ranges from approximately 5 x 10<sup>2</sup> to 2 x 10<sup>3</sup>.
* At PFLOP/s-days ≈ 1, LM Loss ranges from approximately 1 x 10<sup>2</sup> to 5 x 10<sup>2</sup>.
* At PFLOP/s-days ≈ 10, LM Loss ranges from approximately 2 x 10<sup>1</sup> to 1 x 10<sup>2</sup>.
**Full Attention Projection (Red solid lines):**
* There are approximately 6 lines representing Full Attention Projection.
* **Trend:** Similar to MoBA, all Full Attention lines slope downwards, showing a decrease in LM Loss with increasing PFLOP/s-days. The slope is also initially steep and then flattens.
* **Data Points (approximate):**
* At PFLOP/s-days ≈ 0.01, LM Loss ranges from approximately 5 x 10<sup>2</sup> to 1 x 10<sup>4</sup>.
* At PFLOP/s-days ≈ 0.1, LM Loss ranges from approximately 1 x 10<sup>2</sup> to 5 x 10<sup>2</sup>.
* At PFLOP/s-days ≈ 1, LM Loss ranges from approximately 2 x 10<sup>1</sup> to 1 x 10<sup>2</sup>.
* At PFLOP/s-days ≈ 10, LM Loss ranges from approximately 5 x 10<sup>0</sup> to 2 x 10<sup>1</sup>.
### Key Observations
* Full Attention Projection generally exhibits higher LM Loss values than MoBA Projection across the entire range of PFLOP/s-days.
* The spread of lines within each projection method suggests variability in performance across different runs or configurations.
* The logarithmic scales on both axes compress the data, making it difficult to discern precise differences in LM Loss at higher PFLOP/s-days.
* The lines appear to converge at higher PFLOP/s-days, indicating diminishing returns in loss reduction as computational resources increase.
### Interpretation
The chart demonstrates the trade-off between computational cost (PFLOP/s-days) and language model loss. MoBA Projection consistently achieves lower LM Loss for a given computational budget compared to Full Attention Projection. This suggests that MoBA Projection is a more efficient method for training or optimizing the language model. The multiple lines for each method likely represent different hyperparameter settings or training runs, highlighting the inherent variability in machine learning experiments. The convergence of the lines at higher PFLOP/s-days indicates that there's a point of diminishing returns where increasing computational resources yields progressively smaller improvements in LM Loss. This information is valuable for resource allocation and model optimization, as it helps determine the optimal balance between computational cost and model performance. The logarithmic scales suggest that the initial improvements in loss are more significant than those achieved at higher computational costs.