## 3D Coordinate System Diagram
### Overview
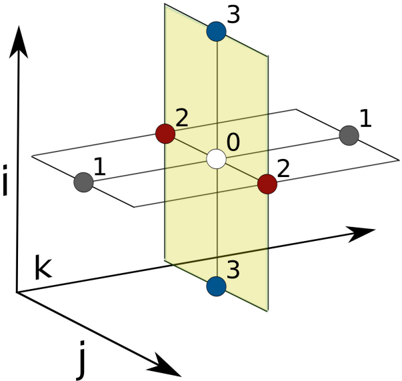
The image is a 3D coordinate system diagram illustrating points in space relative to three axes (i, j, k) and two planes. The diagram includes labeled points and axes, providing a visual representation of spatial relationships.
### Components/Axes
* **Axes:**
* i-axis: Vertical axis pointing upwards.
* j-axis: Horizontal axis pointing to the right.
* k-axis: Axis pointing diagonally into the page, away from the viewer.
* **Planes:**
* A horizontal plane intersecting the i-axis at approximately the '1' mark.
* A vertical plane (yellow) intersecting the j-axis at approximately the '0' mark.
* **Points:**
* White point labeled '0' at the origin.
* Two red points labeled '2', located on the vertical plane.
* Two blue points labeled '3', located on the vertical plane.
* Two gray points labeled '1', located on the horizontal plane.
### Detailed Analysis or ### Content Details
* **Origin:** The white point labeled '0' is at the intersection of all three axes.
* **Horizontal Plane:** The horizontal plane contains the white point '0', and the two gray points labeled '1'.
* The gray point on the left is at approximately i=1, j=-1, k=0.
* The gray point on the right is at approximately i=1, j=1, k=0.
* **Vertical Plane:** The vertical plane contains the white point '0', the two red points labeled '2', and the two blue points labeled '3'.
* The red point at the top is at approximately i=2, j=0, k=0.
* The red point at the bottom is at approximately i=-2, j=0, k=0.
* The blue point at the top is at approximately i=3, j=0, k=0.
* The blue point at the bottom is at approximately i=-3, j=0, k=0.
### Key Observations
* The diagram visualizes points in 3D space relative to the origin.
* The points are symmetrically placed with respect to the origin and the axes.
* The yellow plane is parallel to the i-k plane.
* The horizontal plane is parallel to the j-k plane.
### Interpretation
The diagram illustrates a 3D coordinate system and the spatial relationships between points. The placement of points on the planes and axes provides a visual representation of their coordinates. The symmetry suggests a balanced distribution of points around the origin. The diagram could be used to explain concepts in linear algebra, vector geometry, or 3D modeling.