## Diagram: 3D Seven-Point Stencil
### Overview
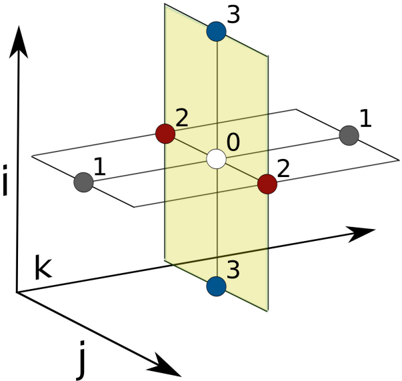
The image displays a 3D coordinate system visualization, commonly used in numerical analysis and computational physics to represent a "seven-point stencil." It illustrates a central node (labeled 0) and its six immediate neighbors (labeled 1, 2, and 3) arranged along three orthogonal axes ($i$, $j$, and $k$). The diagram utilizes two intersecting planes—one horizontal and one vertical—to define the spatial relationships between these points.
### Components/Axes
* **Axes:**
* **$i$ (Vertical):** Represented by the upward-pointing arrow.
* **$j$ (Forward/Diagonal):** Represented by the arrow pointing forward and to the bottom-left.
* **$k$ (Right/Diagonal):** Represented by the arrow pointing to the right and forward.
* **Planes:**
* **Horizontal Plane:** A white-outlined grid plane passing through the center point (0), containing the grey (1) and red (2) points.
* **Vertical Plane:** A translucent yellow-tinted plane passing through the center point (0), containing the blue (3) points.
* **Data Points (Nodes):**
* **0 (White):** Located at the intersection of the horizontal and vertical planes (the origin).
* **1 (Grey):** Two points located on the horizontal plane, aligned along the $k$-axis.
* **2 (Red):** Two points located on the horizontal plane, aligned along the $j$-axis.
* **3 (Blue):** Two points located on the vertical plane, aligned along the $i$-axis.
### Detailed Analysis
The diagram is structured around a central origin point (0). The points are color-coded to indicate their orientation relative to the axes:
* **Vertical Axis ($i$):** The blue points (3) are positioned symmetrically above and below the center point (0) on the vertical yellow plane.
* **Horizontal Plane ($j, k$):**
* **$k$-axis alignment:** The grey points (1) are positioned symmetrically to the left and right of the center point (0) on the horizontal plane.
* **$j$-axis alignment:** The red points (2) are positioned symmetrically forward and backward relative to the center point (0) on the horizontal plane.
The spatial arrangement suggests a grid-based discretization where the central point (0) is influenced by its immediate neighbors in 3D space.
### Key Observations
* **Symmetry:** The diagram exhibits perfect central symmetry; for every point, there is an identical counterpart on the opposite side of the origin (0).
* **Dimensionality:** The use of two distinct planes (horizontal and vertical) effectively separates the horizontal neighbors (1 and 2) from the vertical neighbors (3).
* **Color Coding:** The color scheme is strictly tied to the axis of orientation:
* Blue = Vertical ($i$)
* Red = Horizontal ($j$)
* Grey = Horizontal ($k$)
* White = Origin (0)
### Interpretation
This diagram is a standard representation of a **7-point stencil** used in the **Finite Difference Method (FDM)** for solving partial differential equations (PDEs) in 3D space.
* **Function:** In computational simulations (such as heat transfer, fluid dynamics, or wave propagation), the value at the central node (0) is typically calculated as a weighted average or function of the values at the surrounding nodes (1, 2, and 3).
* **Relationship:** The diagram demonstrates how a 3D volume is discretized. The "1" points represent neighbors in the $k$ direction, "2" points represent neighbors in the $j$ direction, and "3" points represent neighbors in the $i$ direction.
* **Significance:** By visualizing the stencil this way, engineers and mathematicians can easily define the "stencil width" and the connectivity of the grid, which is essential for determining the accuracy and stability of numerical simulations. The separation of the planes helps clarify that the calculation involves neighbors in all three dimensions simultaneously.