## 3D Coordinate System Diagram: Lattice Points on a Plane
### Overview
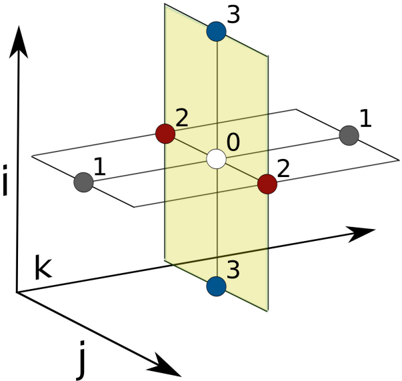
The image is a technical diagram illustrating a three-dimensional Cartesian coordinate system with labeled axes (i, j, k). It depicts a set of discrete points positioned relative to a central origin and a highlighted plane. The diagram is likely used to visualize concepts in physics, mathematics, or crystallography, such as a simple cubic lattice, vector basis, or symmetry operations.
### Components/Axes
* **Coordinate System**: A right-handed 3D Cartesian system.
* **i-axis**: Vertical axis, pointing upward.
* **j-axis**: Horizontal axis, pointing to the right.
* **k-axis**: Axis pointing out of the plane toward the viewer (implied by the perspective).
* **Highlighted Plane**: A translucent yellow plane aligned with the **i-k plane** (where j=0). It is centered on the origin and extends vertically along the i-axis and along the k-axis (into/out of the page).
* **Points**: Seven distinct points are plotted, each with a specific color and numeric label.
* **White Point (Label 0)**: Located at the origin (0, 0, 0).
* **Red Points (Label 2)**: Two points located on the **j-axis**. One is on the positive j-axis, and one is on the negative j-axis. They are equidistant from the origin.
* **Gray Points (Label 1)**: Two points located on the **j-axis**, farther from the origin than the red points. One is on the positive j-axis, and one is on the negative j-axis.
* **Blue Points (Label 3)**: Two points located on the **i-axis**, lying within the yellow i-k plane. One is on the positive i-axis (above the origin), and one is on the negative i-axis (below the origin).
### Detailed Analysis
* **Spatial Relationships & Coordinates**:
* The points are arranged with clear symmetry about the origin.
* Points labeled **1** and **2** lie exclusively on the **j-axis** (j ≠ 0, i=0, k=0). The gray points (1) are at a greater absolute j-coordinate than the red points (2).
* Points labeled **3** lie exclusively on the **i-axis** within the i-k plane (i ≠ 0, j=0, k=0).
* The central point (0) is at the intersection of all axes.
* **Label Sequence**: The numeric labels (0, 1, 2, 3) do not correspond to increasing distance from the origin along a single axis. Instead, they appear to be identifiers for different *types* or *shells* of points in the structure. The sequence suggests a possible ordering: origin (0), first neighbors along j (1), second neighbors along j (2), and neighbors along i (3).
### Key Observations
1. **Symmetry**: The diagram exhibits reflection symmetry across the origin and across the i-k plane.
2. **Planar Emphasis**: The yellow i-k plane is visually emphasized, suggesting it is a plane of interest, such as a mirror plane or a specific crystallographic plane.
3. **Axis-Specific Placement**: Points are segregated by axis: labels 1 and 2 are on the j-axis, while label 3 is on the i-axis. No points are shown on the k-axis or in general 3D positions off the axes.
4. **Color-Label Association**: Each numeric label is consistently associated with a specific color (0=White, 1=Gray, 2=Red, 3=Blue), creating a clear visual key.
### Interpretation
This diagram most likely represents a **simple cubic lattice** or a related discrete grid structure in three dimensions. The points can be interpreted as lattice sites or atomic positions.
* **What the data suggests**: The arrangement shows the nearest neighbors to a central site (0) in a cubic system. The points labeled **1** and **2** along the j-axis could represent first and second nearest neighbors along that direction, though their labeling is counterintuitive if numbers indicate distance. A more plausible interpretation is that the labels denote different **coordination shells** or **sublattices**. For instance, in a body-centered cubic (BCC) context, points 1 and 2 might represent different sets of neighbors.
* **How elements relate**: The yellow plane highlights a specific crystallographic plane (e.g., the (010) plane in Miller indices). The points on this plane (0 and 3) and the points perpendicular to it (1 and 2) demonstrate the anisotropy of the structure—properties differ along the j-direction versus the i-direction.
* **Notable patterns/anomalies**: The absence of points along the k-axis is notable. This could imply the diagram is a 2D slice of a 3D structure, or it is intentionally simplified to illustrate a concept related to planar symmetry or directional bonding. The numbering sequence (0, 1, 2, 3) is not monotonic with distance, which is a key observation; it suggests the labels are categorical rather than ordinal.
**In summary, the diagram is a schematic of a 3D lattice, emphasizing symmetry, planar structure, and the classification of neighboring points relative to a central origin.**