# Technical Document Extraction: Line Graph Analysis
## Top Graph: Precision vs. Weight for IsSupport
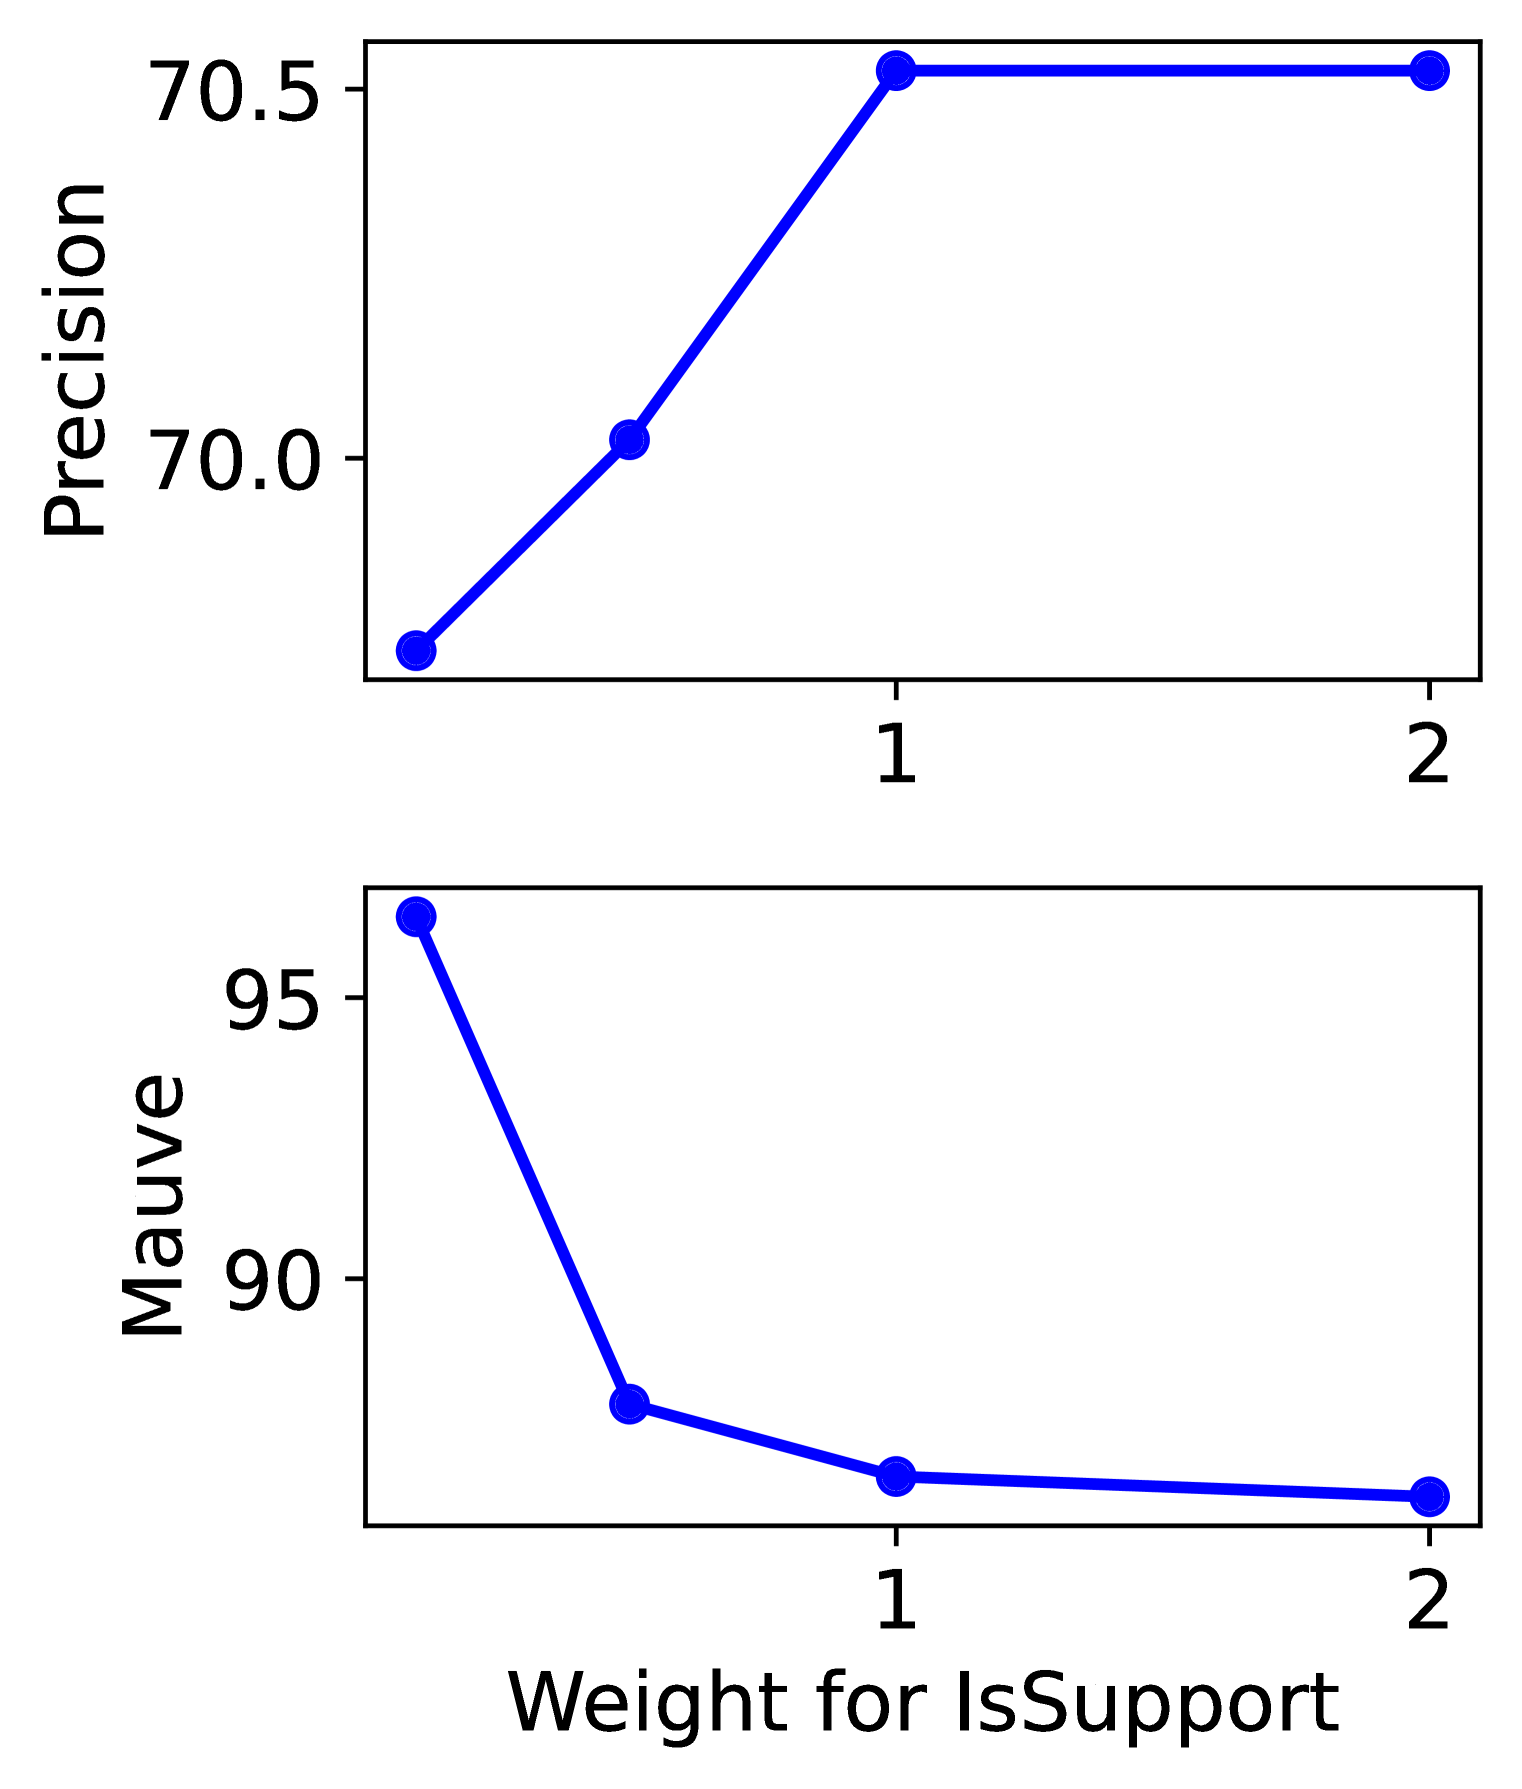
- **Y-Axis Label**: Precision
- Scale: 70.0 to 70.5 (increments of 0.5)
- **X-Axis Label**: Weight for IsSupport
- Categories: 0, 1, 2
- **Line Data Points**:
- (0, 70.0)
- (1, 70.5)
- (2, 70.5)
- **Trend**:
- Precision increases linearly from 70.0 to 70.5 as Weight for IsSupport increases from 0 to 1.
- Precision plateaus at 70.5 for Weight for IsSupport = 2.
## Bottom Graph: Mauve vs. Weight for IsSupport
- **Y-Axis Label**: Mauve
- Scale: 89.5 to 95.5 (increments of 1)
- **X-Axis Label**: Weight for IsSupport
- Categories: 0, 1, 2
- **Line Data Points**:
- (0, 95.5)
- (1, 90.5)
- (2, 89.5)
- **Trend**:
- Mauve decreases sharply from 95.5 to 90.5 as Weight for IsSupport increases from 0 to 1.
- Mauve decreases gradually from 90.5 to 89.5 as Weight for IsSupport increases from 1 to 2.
## Key Observations
1. **Precision**:
- Stable at higher weights (1 and 2) after an initial increase.
2. **Mauve**:
- Sensitive to weight changes, with a significant drop at weight = 1 and a smaller decline at weight = 2.
3. **Axis Consistency**:
- Both graphs share the same x-axis ("Weight for IsSupport") with identical categorical values (0, 1, 2).
4. **Line Color**:
- Both lines are blue, with no legend present to differentiate categories.
## Data Table Reconstruction
| Weight for IsSupport | Precision | Mauve |
|----------------------|-----------|--------|
| 0 | 70.0 | 95.5 |
| 1 | 70.5 | 90.5 |
| 2 | 70.5 | 89.5 |
## Notes
- No legends or additional annotations are present in the graphs.
- All data points are explicitly marked with circular markers.
- Trends are derived from linear interpolation between plotted points.