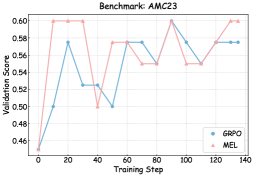
\n
## Line Chart: Benchmark: AMC23
### Overview
The image displays a line chart comparing the validation score performance of two methods, labeled "GRPO" and "MEL," over the course of training steps on the AMC23 benchmark. The chart tracks how the validation score for each method changes as training progresses.
### Components/Axes
* **Chart Title:** "Benchmark: AMC23" (centered at the top).
* **X-Axis:** Labeled "Training Step." The axis is linear and marked with major ticks at intervals of 20, from 0 to 140. Minor ticks are present at intervals of 10.
* **Y-Axis:** Labeled "Validation Score." The axis is linear and marked with major ticks at intervals of 0.02, from 0.46 to 0.60.
* **Legend:** Located in the top-right corner of the plot area.
* A blue line with circle markers is labeled "GRPO".
* A red line with triangle markers is labeled "MEL".
* **Grid:** A light gray grid is present, aligning with the major ticks on both axes.
### Detailed Analysis
**Data Series: GRPO (Blue line, circle markers)**
* **Trend:** The GRPO series shows an initial sharp increase, followed by a period of fluctuation, and then stabilizes at a higher level towards the end of the tracked steps.
* **Approximate Data Points (Training Step, Validation Score):**
* (0, 0.46)
* (10, 0.50)
* (20, 0.58)
* (30, 0.52)
* (40, 0.52)
* (50, 0.50)
* (60, 0.58)
* (70, 0.58)
* (80, 0.58)
* (90, 0.60) - **Peak Value**
* (100, 0.56)
* (110, 0.58)
* (120, 0.58)
* (130, 0.58)
**Data Series: MEL (Red line, triangle markers)**
* **Trend:** The MEL series exhibits a very rapid initial rise to a plateau, followed by a significant drop, a recovery, a second dip, and a final rise to match its earlier peak.
* **Approximate Data Points (Training Step, Validation Score):**
* (0, 0.46)
* (10, 0.60) - **Reaches early plateau**
* (20, 0.60)
* (30, 0.60)
* (40, 0.50) - **Significant drop**
* (50, 0.58)
* (60, 0.58)
* (70, 0.55)
* (80, 0.55) - **Second dip**
* (90, 0.60) - **Matches early peak**
* (100, 0.55)
* (110, 0.55)
* (120, 0.58)
* (130, 0.60) - **Final value matches peak**
### Key Observations
1. **Initial Performance:** Both methods start at the same score (0.46). MEL achieves a much higher score (0.60) by step 10, while GRPO reaches 0.50.
2. **Volatility:** The MEL series shows greater volatility, with two distinct drops (at step 40 and steps 70-80/100-110) compared to GRPO's more moderate fluctuations.
3. **Peak Performance:** Both methods achieve a peak validation score of 0.60. GRPO hits this peak once at step 90. MEL hits this peak at steps 10-30, 90, and 130.
4. **Convergence:** By the final recorded step (130), both methods have converged to very similar scores: GRPO at 0.58 and MEL at 0.60.
5. **Relative Position:** The MEL line is generally above the GRPO line for the first 30 steps, falls below it between steps 40-50 and 70-80, and then intertwines with it for the remainder of the chart.
### Interpretation
This chart suggests a comparative analysis of two training methodologies (GRPO and MEL) on the AMC23 benchmark. The data indicates that **MEL learns faster initially**, reaching near-peak performance within 10 steps, but this comes with **less stability**, as evidenced by its sharp performance drops. **GRPO demonstrates a more gradual and stable learning curve**, with its performance improving in a less erratic manner, though it takes longer to reach its peak.
The fact that both methods ultimately achieve similar final scores (0.58 vs. 0.60) implies that for this specific benchmark, the choice between them may depend on other factors: if rapid initial convergence is critical, MEL might be preferred despite its instability. If consistent, stable improvement is valued, GRPO could be the better choice. The repeated drops in MEL's performance could indicate sensitivity to certain training phases or batches, warranting further investigation into the training dynamics of that method. The chart effectively communicates that while the endpoints are similar, the journey to get there differs significantly between the two approaches.