## Line Chart: Validation Score vs. Training Step (Benchmark: AMC23)
### Overview
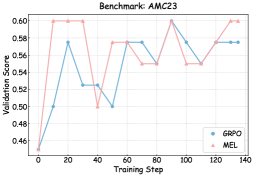
This image presents a line chart illustrating the validation score of two models, GRPO and MEL, against the training step. The chart appears to track the performance of these models during a training process on the AMC23 benchmark.
### Components/Axes
* **Title:** Benchmark: AMC23 (positioned at the top-center)
* **X-axis:** Training Step (ranging from approximately 0 to 140, with markers at 0, 20, 40, 60, 80, 100, 120, and 140)
* **Y-axis:** Validation Score (ranging from approximately 0.46 to 0.61, with markers at 0.46, 0.48, 0.50, 0.52, 0.54, 0.56, 0.58, 0.60)
* **Legend:** Located in the bottom-right corner.
* GRPO (represented by a light blue line)
* MEL (represented by a light red line)
### Detailed Analysis
**GRPO (Light Blue Line):**
The GRPO line initially slopes upward from approximately 0.47 at a training step of 0 to a peak of approximately 0.58 at a training step of 20. It then declines to approximately 0.52 at a training step of 40, rises again to approximately 0.58 at a training step of 60, dips to approximately 0.55 at a training step of 80, and then rises to approximately 0.59 at a training step of 100. Finally, it plateaus around 0.58 from training step 100 to 140.
* Step 0: ~0.47
* Step 20: ~0.58
* Step 40: ~0.52
* Step 60: ~0.58
* Step 80: ~0.55
* Step 100: ~0.59
* Step 120: ~0.56
* Step 140: ~0.58
**MEL (Light Red Line):**
The MEL line exhibits a rapid increase from approximately 0.47 at a training step of 0 to approximately 0.60 at a training step of 20. It then declines to approximately 0.52 at a training step of 40, rises to approximately 0.58 at a training step of 60, dips to approximately 0.55 at a training step of 80, peaks at approximately 0.60 at a training step of 100, and then declines to approximately 0.59 at a training step of 140.
* Step 0: ~0.47
* Step 20: ~0.60
* Step 40: ~0.52
* Step 60: ~0.58
* Step 80: ~0.55
* Step 100: ~0.60
* Step 120: ~0.56
* Step 140: ~0.59
### Key Observations
* Both models show an initial increase in validation score, followed by fluctuations.
* MEL generally achieves a higher validation score than GRPO, especially in the early stages of training (up to step 60).
* Both models appear to converge towards a similar validation score around training step 140.
* The fluctuations suggest that the training process is not entirely smooth and may be sensitive to the training step.
### Interpretation
The chart demonstrates the learning curves of two models (GRPO and MEL) during training on the AMC23 benchmark. The validation score serves as a metric for the model's generalization performance on unseen data. The initial increase in validation score indicates that both models are learning from the training data. The subsequent fluctuations suggest that the models are experiencing some degree of overfitting or are encountering challenges in generalizing to the validation set.
The fact that MEL consistently outperforms GRPO suggests that MEL may be a more effective model for this particular benchmark. However, the convergence of the two models towards the end of the training process indicates that GRPO is also improving and may eventually achieve comparable performance.
The fluctuations in validation score could be due to several factors, such as the stochastic nature of the training process, the choice of hyperparameters, or the complexity of the dataset. Further analysis would be needed to determine the root cause of these fluctuations and to optimize the training process for better performance. The data suggests that training beyond step 100 provides diminishing returns.