# Technical Document Extraction: Image Analysis
## Image Description
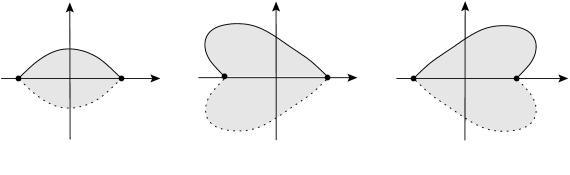
The image consists of three distinct panels, each depicting a different mathematical or graphical representation. All panels share a common coordinate system with labeled axes:
- **X-axis**: Labeled "x" with an arrow pointing to the right.
- **Y-axis**: Labeled "y" with an arrow pointing upward.
### Panel 1 (Left)
- **Graph Type**: Parabolic curve.
- **Shape**: A symmetric "U"-shaped curve opening downward.
- **Key Features**:
- The curve intersects the x-axis at two points (roots).
- The vertex (maximum point) is at the origin (0,0).
- A shaded region is bounded between the curve and the x-axis.
### Panel 2 (Middle)
- **Graph Type**: Heart-shaped curve.
- **Shape**: A closed, asymmetric curve resembling a heart.
- **Key Features**:
- The curve has a loop on the left side and a pointed tip on the right.
- A shaded region is enclosed within the curve.
- The curve intersects the x-axis at two points (roots).
### Panel 3 (Right)
- **Graph Type**: Modified heart-shaped curve.
- **Shape**: A heart-like curve with an extended tail on the right side.
- **Key Features**:
- The curve has a loop on the left and a tail extending to the right.
- A shaded region is enclosed within the curve.
- The curve intersects the x-axis at two points (roots).
## Textual Information
No explicit textual labels, legends, or data tables are present in the image. The axes are labeled "x" and "y," but no numerical values, units, or additional annotations are provided.
## Spatial Grounding
- **Legend**: Not applicable (no legend present).
- **Data Series**: No numerical data points or color-coded series are visible.
## Trend Verification
- **Panel 1**: The parabolic curve slopes downward from the vertex at (0,0) to the x-axis intersections.
- **Panel 2**: The heart-shaped curve forms a closed loop with a peak on the left and a tip on the right.
- **Panel 3**: The modified heart-shaped curve includes an extended tail, altering the symmetry of the original heart shape.
## Component Isolation
- **Header**: No header present.
- **Main Chart**: Three panels with distinct curves and shaded regions.
- **Footer**: No footer present.
## Conclusion
The image provides visual representations of three mathematical curves (parabola, heart, and modified heart) but lacks textual data, labels, or legends. The absence of numerical values or explicit annotations limits the extraction of quantitative information.