\n
## Horizontal Bar Chart: LIME Explanation for 'positive' prediction (Instance 5)
### Overview
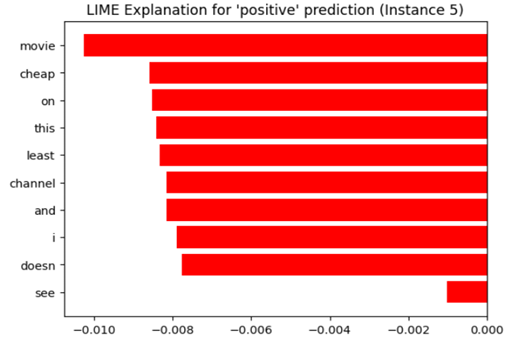
The image displays a horizontal bar chart generated by LIME (Local Interpretable Model-agnostic Explanations) to explain a 'positive' prediction for instance 5. The chart shows the contribution of different words to the prediction, with bars extending to the left (negative values) and right (positive values) of the y-axis. The length of each bar represents the weight or importance of the corresponding word in the prediction.
### Components/Axes
* **Title:** "LIME Explanation for 'positive' prediction (Instance 5)" - positioned at the top-center.
* **X-axis:** Labeled with numerical values ranging from approximately -0.010 to 0.000. The axis represents the contribution score of each word.
* **Y-axis:** Lists the following words (from top to bottom):
* movie
* cheap
* on
* this
* least
* channel
* and
* i
* doesn
* see
* **Bars:** Horizontal red bars representing the contribution score of each word.
### Detailed Analysis
The bars are all red and extend either to the left or right of the y-axis. The trend is overwhelmingly negative, with most words contributing negatively to the 'positive' prediction.
Here's a breakdown of approximate values, reading from top to bottom:
* **movie:** Approximately -0.0095
* **cheap:** Approximately -0.0085
* **on:** Approximately -0.0080
* **this:** Approximately -0.0075
* **least:** Approximately -0.0070
* **channel:** Approximately -0.0065
* **and:** Approximately -0.0060
* **i:** Approximately -0.0055
* **doesn:** Approximately -0.0030
* **see:** Approximately -0.0005
### Key Observations
* All words have a negative contribution score, meaning they are pushing the prediction *away* from 'positive'.
* The word "movie" has the most negative contribution, followed by "cheap" and "on".
* The word "see" has the smallest negative contribution, closest to zero.
* The chart suggests that the presence of these words, despite the overall 'positive' prediction, is somewhat counterintuitive.
### Interpretation
This LIME explanation reveals that the model associates the instance 5 prediction with words that, in isolation, might suggest a negative sentiment or context. The fact that all words contribute negatively suggests that the model is relying on subtle cues or combinations of these words to arrive at the 'positive' prediction. It's possible that the model is picking up on sarcasm, irony, or a specific context where these words are used in a positive way.
The chart highlights the importance of understanding *why* a model makes a prediction, not just *what* the prediction is. It also demonstrates the potential for LIME to uncover unexpected or counterintuitive relationships between features and predictions. The negative contributions of these words could indicate a need for further investigation into the training data or model behavior. It is also possible that the model is not fully capturing the nuances of language.