\n
## Horizontal Bar Chart: LIME Explanation for 'positive' prediction (Instance 5)
### Overview
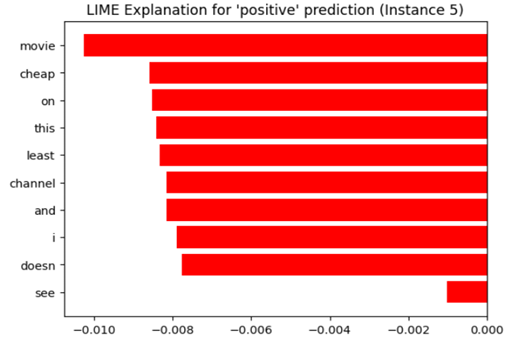
This image displays a horizontal bar chart generated by LIME (Local Interpretable Model-agnostic Explanations), a machine learning interpretability technique. The chart visualizes the contribution of individual words (features) from a text instance towards a model's 'positive' class prediction. All displayed contributions are negative, indicating these words, in this specific context, pushed the prediction away from 'positive'.
### Components/Axes
* **Chart Title:** "LIME Explanation for 'positive' prediction (Instance 5)" - Located at the top center.
* **Y-Axis (Vertical):** Lists the feature words from the analyzed text instance. The words are, from top to bottom: `movie`, `cheap`, `on`, `this`, `least`, `channel`, `and`, `i`, `doesn`, `see`.
* **X-Axis (Horizontal):** Represents the feature contribution weight. The scale runs from `-0.010` on the far left to `0.000` on the far right, with major tick marks at `-0.010`, `-0.008`, `-0.006`, `-0.004`, `-0.002`, and `0.000`.
* **Data Series:** A single series of horizontal red bars. Each bar originates from the `0.000` line on the right and extends leftward, indicating a negative contribution value.
* **Legend:** Not present. The single color (red) represents the contribution magnitude for each listed word.
### Detailed Analysis
The chart quantifies how much each word contributed to the model's prediction score for the 'positive' class. A negative value means the word made the 'positive' prediction less likely.
**Word Contributions (Approximate Values, read from x-axis):**
1. **movie:** Bar extends to approximately `-0.010`. This is the largest negative contributor.
2. **cheap:** Bar extends to approximately `-0.0085`.
3. **on:** Bar extends to approximately `-0.0085`.
4. **this:** Bar extends to approximately `-0.0085`.
5. **least:** Bar extends to approximately `-0.0085`.
6. **channel:** Bar extends to approximately `-0.008`.
7. **and:** Bar extends to approximately `-0.008`.
8. **i:** Bar extends to approximately `-0.008`.
9. **doesn:** Bar extends to approximately `-0.0078`.
10. **see:** Bar extends to approximately `-0.001`. This is the smallest negative contributor.
**Trend Verification:** All bars slope leftward from the zero line, confirming a consistent trend of negative contributions across all displayed features for this instance.
### Key Observations
1. **Uniform Direction:** Every single word feature shown has a negative contribution weight. There are no positive contributors displayed in this explanation.
2. **Magnitude Clustering:** The contributions for words 2 through 9 (`cheap` to `i`) are clustered within a narrow range (approx. `-0.0078` to `-0.0085`), suggesting similar levels of influence.
3. **Outliers:** `movie` is a clear outlier with the strongest negative pull (approx. `-0.010`). `see` is an outlier in the opposite direction, with a very weak negative contribution (approx. `-0.001`).
4. **Spatial Layout:** The legend (word list) is positioned on the left (y-axis). The data (bars) extend from the right (zero line) towards the left, with their length corresponding to the x-axis scale at the bottom.
### Interpretation
This LIME explanation reveals a counter-intuitive scenario. The model's final prediction for "Instance 5" was 'positive', yet the local explanation highlights that the most influential words *within this specific text snippet* all worked against that prediction.
This suggests one of several possibilities:
* **Compensating Factors:** The overall 'positive' prediction is likely driven by other words or features in the full text that are *not* shown in this top-10 explanation. The negative contributions here are outweighed by stronger positive contributions from other features.
* **Contextual Negation:** Words like "cheap" and "doesn" (likely part of "doesn't") are inherently negative. Their strong negative contribution is expected. The presence of "movie" as the strongest negative contributor is more interesting—it may be a neutral word that, in the specific context of this review (e.g., "this movie is cheap..."), became a negative signal.
* **Model Behavior:** The chart effectively demonstrates LIME's purpose: to provide a local, interpretable snapshot of model reasoning, which can sometimes contradict the global prediction. It shows the model is using these words as negative signals, even if the final classification was positive.
In essence, this chart does not explain *why* the prediction was positive; it explains which parts of *this text* were most responsible for pushing the prediction *away* from positive. The true positive drivers are not visualized here.