\n
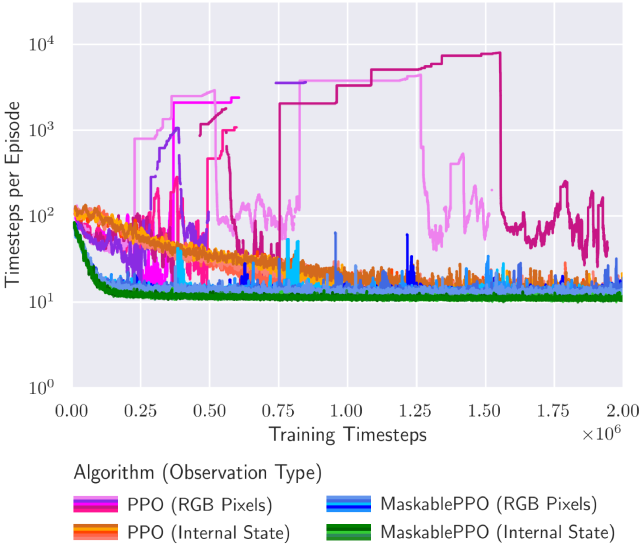
## Line Chart: Timesteps per Episode vs. Training Timesteps
### Overview
The image presents a line chart illustrating the relationship between training timesteps and the number of timesteps per episode for different reinforcement learning algorithms. The chart displays performance metrics over approximately 2 million training timesteps. The y-axis represents "Timesteps per Episode" on a logarithmic scale, while the x-axis represents "Training Timesteps". Multiple algorithms are compared, each represented by a different colored line.
### Components/Axes
* **X-axis:** "Training Timesteps" ranging from 0 to 2,000,000 (2 x 10<sup>6</sup>).
* **Y-axis:** "Timesteps per Episode" on a logarithmic scale, ranging from 10<sup>0</sup> to 10<sup>4</sup>.
* **Legend:** Located at the bottom-center of the chart, identifying the algorithms and their corresponding observation types:
* PPO (RGB Pixels) - Dark Red
* PPO (Internal State) - Orange
* MaskablePPO (RGB Pixels) - Blue
* MaskablePPO (Internal State) - Teal
* **Gridlines:** Present to aid in reading values.
### Detailed Analysis
The chart displays four distinct lines, each representing a different algorithm.
* **PPO (RGB Pixels) - Dark Red:** This line initially starts around 10<sup>2</sup> timesteps per episode and fluctuates between approximately 50 and 200 timesteps per episode for the majority of the training period. There are several spikes, reaching up to approximately 300 timesteps per episode around 0.25 x 10<sup>6</sup>, 0.75 x 10<sup>6</sup>, and 1.75 x 10<sup>6</sup> training timesteps.
* **PPO (Internal State) - Orange:** This line begins around 10<sup>2</sup> timesteps per episode and generally remains lower than the RGB Pixels version, fluctuating between approximately 20 and 100 timesteps per episode. It exhibits less volatility than the RGB Pixels version.
* **MaskablePPO (RGB Pixels) - Blue:** This line shows a dramatic increase in timesteps per episode. It starts around 10<sup>1</sup> timesteps per episode and rapidly increases to approximately 10<sup>3</sup> timesteps per episode around 0.5 x 10<sup>6</sup> training timesteps. It then plateaus around 10<sup>3</sup>-10<sup>4</sup> timesteps per episode for the remainder of the training period.
* **MaskablePPO (Internal State) - Teal:** This line remains consistently low, fluctuating between approximately 10 and 20 timesteps per episode throughout the entire training period.
### Key Observations
* **MaskablePPO (RGB Pixels)** demonstrates significantly longer episodes compared to the other algorithms, especially after 0.5 x 10<sup>6</sup> training timesteps.
* **PPO (RGB Pixels)** exhibits more variability in episode length than **PPO (Internal State)**.
* **MaskablePPO (Internal State)** consistently has the shortest episode lengths.
* The RGB Pixel versions of both PPO and MaskablePPO show more fluctuations than their Internal State counterparts.
### Interpretation
The data suggests that the MaskablePPO algorithm, when using RGB Pixels as observation input, is capable of learning to sustain episodes for a much longer duration than the other algorithms. This could indicate a greater ability to explore the environment and avoid premature termination of episodes. The PPO algorithm with RGB Pixels shows a moderate performance, but with higher variance. The Internal State versions of both algorithms appear to converge to shorter, more stable episodes. The spikes in the PPO (RGB Pixels) line might represent periods of exploration or encountering challenging states. The logarithmic scale on the y-axis emphasizes the large difference in episode lengths achieved by MaskablePPO (RGB Pixels) compared to the others. The choice of observation type (RGB Pixels vs. Internal State) appears to significantly impact the algorithm's performance, with RGB Pixels generally leading to longer, but more variable, episodes.