# Technical Document Analysis of Bar Chart
## 1. Labels and Axis Titles
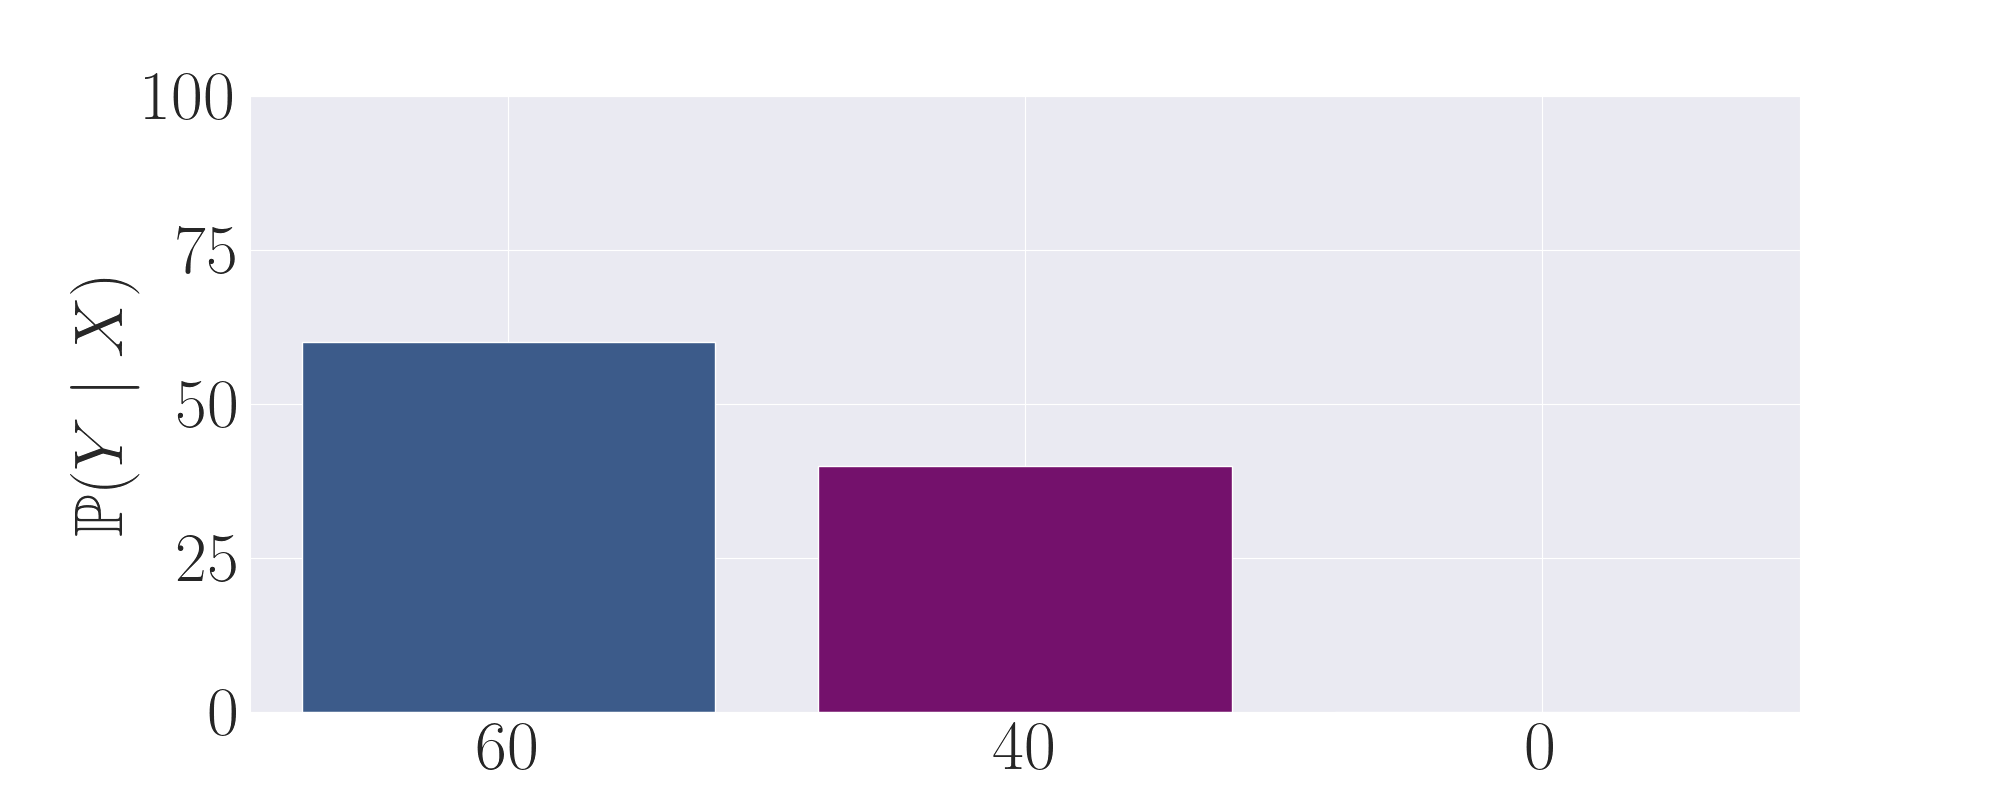
- **Y-Axis**: Labeled `ℙ(Y | X)` (probability of Y given X), scaled from 0 to 100 in increments of 25.
- **X-Axis**: Displays categorical values: `60`, `40`, and `0` (no bar present at `0`).
- **Legend**: Located at the **bottom-right** of the chart, mapping colors to labels:
- Dark blue: `60`
- Purple: `40`
## 2. Key Trends and Data Points
- **Bar Heights**:
- Dark blue bar (value `60`): Reaches approximately **60** on the Y-axis.
- Purple bar (value `40`): Reaches approximately **40** on the Y-axis.
- **Trend**: Probability decreases from `60` to `40`; no data represented at `0`.
## 3. Legend and Color Mapping
- **Legend Position**: Bottom-right corner.
- **Color Consistency**:
- Dark blue bar corresponds to `60` (matches legend).
- Purple bar corresponds to `40` (matches legend).
## 4. Chart Components
- **Main Chart Area**: Contains two bars (dark blue and purple) aligned with X-axis categories.
- **Axes**:
- Y-axis: Vertical, labeled `ℙ(Y | X)`.
- X-axis: Horizontal, labeled with discrete values (`60`, `40`, `0`).
- **Gridlines**: Subtle gridlines visible in the background for reference.
## 5. Missing Data
- No bar present at `X = 0`, indicating either:
- Absence of data for this category.
- Probability of `ℙ(Y | X = 0)` is zero or undefined.
## 6. Spatial Grounding
- **Legend Coordinates**: Bottom-right (exact pixel position unspecified in image).
- **Bar Alignment**: Bars centered over their respective X-axis labels.
## 7. Trend Verification
- **Dark Blue Series (`60`)**: Single bar at `X = 60`, height ~60.
- **Purple Series (`40`)**: Single bar at `X = 40`, height ~40.
- **No Data at `X = 0`**: Confirmed by absence of bar.
## 8. Component Isolation
- **Regions**:
- **Header**: None (no title or subtitle).
- **Main Chart**: Bars and axes dominate the visual space.
- **Footer**: Legend occupies the bottom-right.
## 9. Additional Notes
- **Language**: All text is in English (no non-English content detected).
- **Data Table**: No embedded table present; data represented visually via bars.
## Conclusion
The chart visualizes a probability distribution (`ℙ(Y | X)`) for two discrete X-values (`60` and `40`), with no data for `X = 0`. Probability decreases as X decreases from 60 to 40.