## Line Chart: CIFAR-10 Test Accuracy vs. α Parameter
### Overview
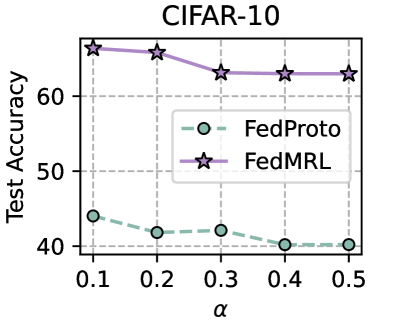
The chart compares the test accuracy of two machine learning models (FedProto and FedMRL) across varying values of the hyperparameter α (alpha) on the CIFAR-10 dataset. Test accuracy is measured on the y-axis (40-60%), while α ranges from 0.1 to 0.5 on the x-axis.
### Components/Axes
- **X-axis (α)**: Discrete values at 0.1, 0.2, 0.3, 0.4, 0.5
- **Y-axis (Test Accuracy)**: Percentage scale from 40% to 60%
- **Legend**: Located in the top-right corner, with:
- **FedProto**: Dashed teal line with circle markers
- **FedMRL**: Solid purple line with star markers
### Detailed Analysis
1. **FedProto (Teal Line)**:
- Starts at ~45% accuracy at α=0.1
- Gradually declines to ~40% by α=0.5
- Slight plateau between α=0.3 and α=0.5 (~40-41%)
- Trend: Consistent downward slope with minimal fluctuation
2. **FedMRL (Purple Line)**:
- Begins at ~65% accuracy at α=0.1
- Drops sharply to ~63% at α=0.3
- Stabilizes between α=0.3 and α=0.5 (~63-64%)
- Trend: Initial decline followed by plateau
### Key Observations
- FedMRL consistently outperforms FedProto across all α values (20-30% higher accuracy)
- FedProto shows a steady degradation as α increases
- FedMRL demonstrates robustness to α changes after initial drop
- No overlapping confidence intervals between the two models
### Interpretation
The data suggests FedMRL is significantly more robust to hyperparameter α variations than FedProto for CIFAR-10 classification. The stability of FedMRL's accuracy after α=0.3 indicates potential insensitivity to this parameter in later training stages. In contrast, FedProto's continuous decline implies α plays a critical role in its performance. These results could guide hyperparameter tuning strategies, with FedMRL being preferable for scenarios requiring α flexibility. The stark performance gap raises questions about FedProto's architectural limitations or training dynamics under varying α conditions.