\n
## Chart: Nuclear Response and Run Length over Time
### Overview
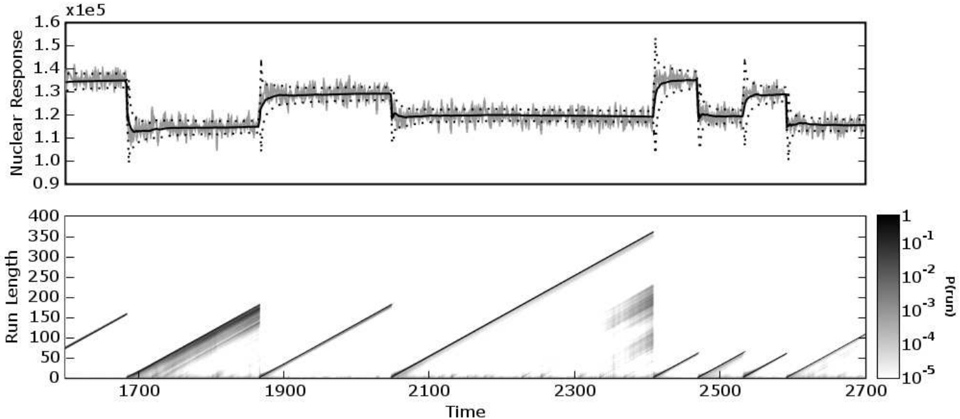
The image presents two charts stacked vertically. The top chart displays a time series of "Nuclear Response" with associated variability, indicated by grey lines. The bottom chart shows a heatmap-like representation of "Run Length" over "Time", with color intensity representing the value of "Prnm" (likely a unit of measurement). Both charts share a common x-axis representing "Time".
### Components/Axes
* **Top Chart:**
* **Y-axis:** "Nuclear Response" (scale from approximately 0.9 x 10^5 to 1.6 x 10^5).
* **X-axis:** "Time" (unspecified units, ranging from approximately 1600 to 2700).
* **Data Series:** A thick black line representing the average "Nuclear Response" over time, with numerous thin grey lines indicating individual data points or variability.
* **Markers:** Vertical dotted lines are present at approximately Time = 1850, 2150, 2450, and 2650.
* **Bottom Chart:**
* **Y-axis:** "Run Length" (scale from 0 to 350).
* **X-axis:** "Time" (same scale as the top chart, approximately 1600 to 2700).
* **Color Scale (Legend):** Located in the top-right corner, representing "Prnm" values. The scale ranges from 1 (darkest color) to 10^-5 (lightest color). The color gradient is as follows:
* 1 (darkest)
* 10^-1
* 10^-2
* 10^-3
* 10^-4
* 10^-5 (lightest)
### Detailed Analysis or Content Details
* **Top Chart:** The "Nuclear Response" line starts at approximately 1.45 x 10^5 at Time = 1600. It decreases to a minimum of approximately 1.15 x 10^5 around Time = 1750. The line then fluctuates between approximately 1.2 x 10^5 and 1.4 x 10^5 with several peaks and valleys. There are noticeable spikes in "Nuclear Response" around Time = 1850, 2150, 2450, and 2650, indicated by the dotted lines. The final value at Time = 2700 is approximately 1.18 x 10^5.
* **Bottom Chart:** The chart displays a diagonal pattern, indicating a relationship between "Time" and "Run Length". The color intensity varies across the chart. Darker shades (higher "Prnm" values) are concentrated in the lower-left region (early times, short run lengths) and along a diagonal band. Lighter shades (lower "Prnm" values) are present in the upper-right region (later times, longer run lengths). There are areas of higher "Prnm" values (darker colors) around Time = 1850, 2150, 2450, and 2650, corresponding to the spikes in the top chart. The color intensity decreases as "Run Length" increases.
### Key Observations
* The spikes in "Nuclear Response" in the top chart correlate with areas of higher "Prnm" values in the bottom chart.
* The "Run Length" generally increases with "Time".
* The "Prnm" values are highest at shorter "Run Lengths" and earlier "Times".
* The grey lines in the top chart show significant variability in the "Nuclear Response" around the average line.
### Interpretation
The data suggests a dynamic system where "Nuclear Response" fluctuates over time, with occasional spikes. The "Run Length" appears to be related to the duration of these fluctuations or events. The "Prnm" value, whatever unit it represents, seems to be a measure of the intensity or frequency of these events. The correlation between the spikes in "Nuclear Response" and the higher "Prnm" values in the bottom chart indicates that these spikes are significant events within the system. The decreasing "Prnm" values with increasing "Run Length" could suggest that events become less intense or frequent as they persist over time. The variability in the "Nuclear Response" (shown by the grey lines) indicates that the system is not entirely predictable and is subject to random fluctuations. The dotted lines likely mark specific events or interventions that trigger changes in the system's behavior. Without knowing the context of this data, it's difficult to provide a more specific interpretation, but it appears to represent a complex system with dynamic behavior and measurable events.