## Gaussian Distribution Chart: Comparison of H1 and H2
### Overview
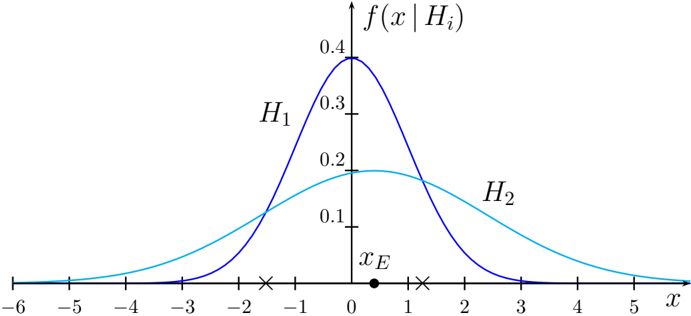
The image is a chart displaying two Gaussian distribution curves, labeled H1 (dark blue) and H2 (light blue). The chart compares the probability density functions of these two distributions over a range of x values. The x-axis ranges from -6 to 6, and the y-axis, representing the probability density f(x | Hi), ranges from 0 to 0.4.
### Components/Axes
* **X-axis:** Represents the variable 'x', ranging from -6 to 6 with integer increments.
* **Y-axis:** Represents the probability density function 'f(x | Hi)', ranging from 0 to 0.4 with increments of 0.1.
* **Curve H1 (dark blue):** A Gaussian distribution centered around x=0, with a peak probability density of approximately 0.38.
* **Curve H2 (light blue):** A Gaussian distribution centered around x=0, but with a wider spread and a peak probability density of approximately 0.18.
* **x_E:** A point marked on the x-axis at x=0.
* **Crosses:** There are crosses on the x-axis at x = -2, x = -1, x = 1.
### Detailed Analysis or ### Content Details
* **Curve H1 (dark blue):**
* Trend: The curve rises from approximately 0 at x=-6 to a peak of approximately 0.38 at x=0, then decreases back to approximately 0 at x=6.
* Peak: Approximately 0.38 at x=0.
* Value at x=-2: Approximately 0.02.
* Value at x=2: Approximately 0.02.
* **Curve H2 (light blue):**
* Trend: The curve rises from approximately 0 at x=-6 to a peak of approximately 0.18 at x=0, then decreases back to approximately 0 at x=6.
* Peak: Approximately 0.18 at x=0.
* Value at x=-2: Approximately 0.10.
* Value at x=2: Approximately 0.10.
* **x_E:** Located at x=0.
### Key Observations
* Both distributions, H1 and H2, are centered at x=0.
* H1 has a higher peak and narrower spread compared to H2.
* H2 has a lower peak and wider spread compared to H1.
* The probability density of H1 is significantly higher than H2 near x=0.
* The probability density of H2 is higher than H1 for x values further away from 0 (e.g., around x=-3 or x=3).
### Interpretation
The chart illustrates two different hypotheses (H1 and H2) about the distribution of a variable 'x'. Both hypotheses assume a Gaussian distribution centered at 0, but they differ in their variance (spread). H1 suggests a smaller variance, indicating that values of 'x' are more likely to be close to 0. H2 suggests a larger variance, indicating that values of 'x' are more likely to be spread out over a wider range. The crosses on the x-axis at x = -2, x = -1, x = 1 may represent observed data points. The point x_E at x=0 could represent an estimated value or a point of interest. The chart is useful for visualizing and comparing the likelihood of different values of 'x' under each hypothesis.