## Line Chart: Zephyr-7B-Beta-Chat Loss vs. Epoch
### Overview
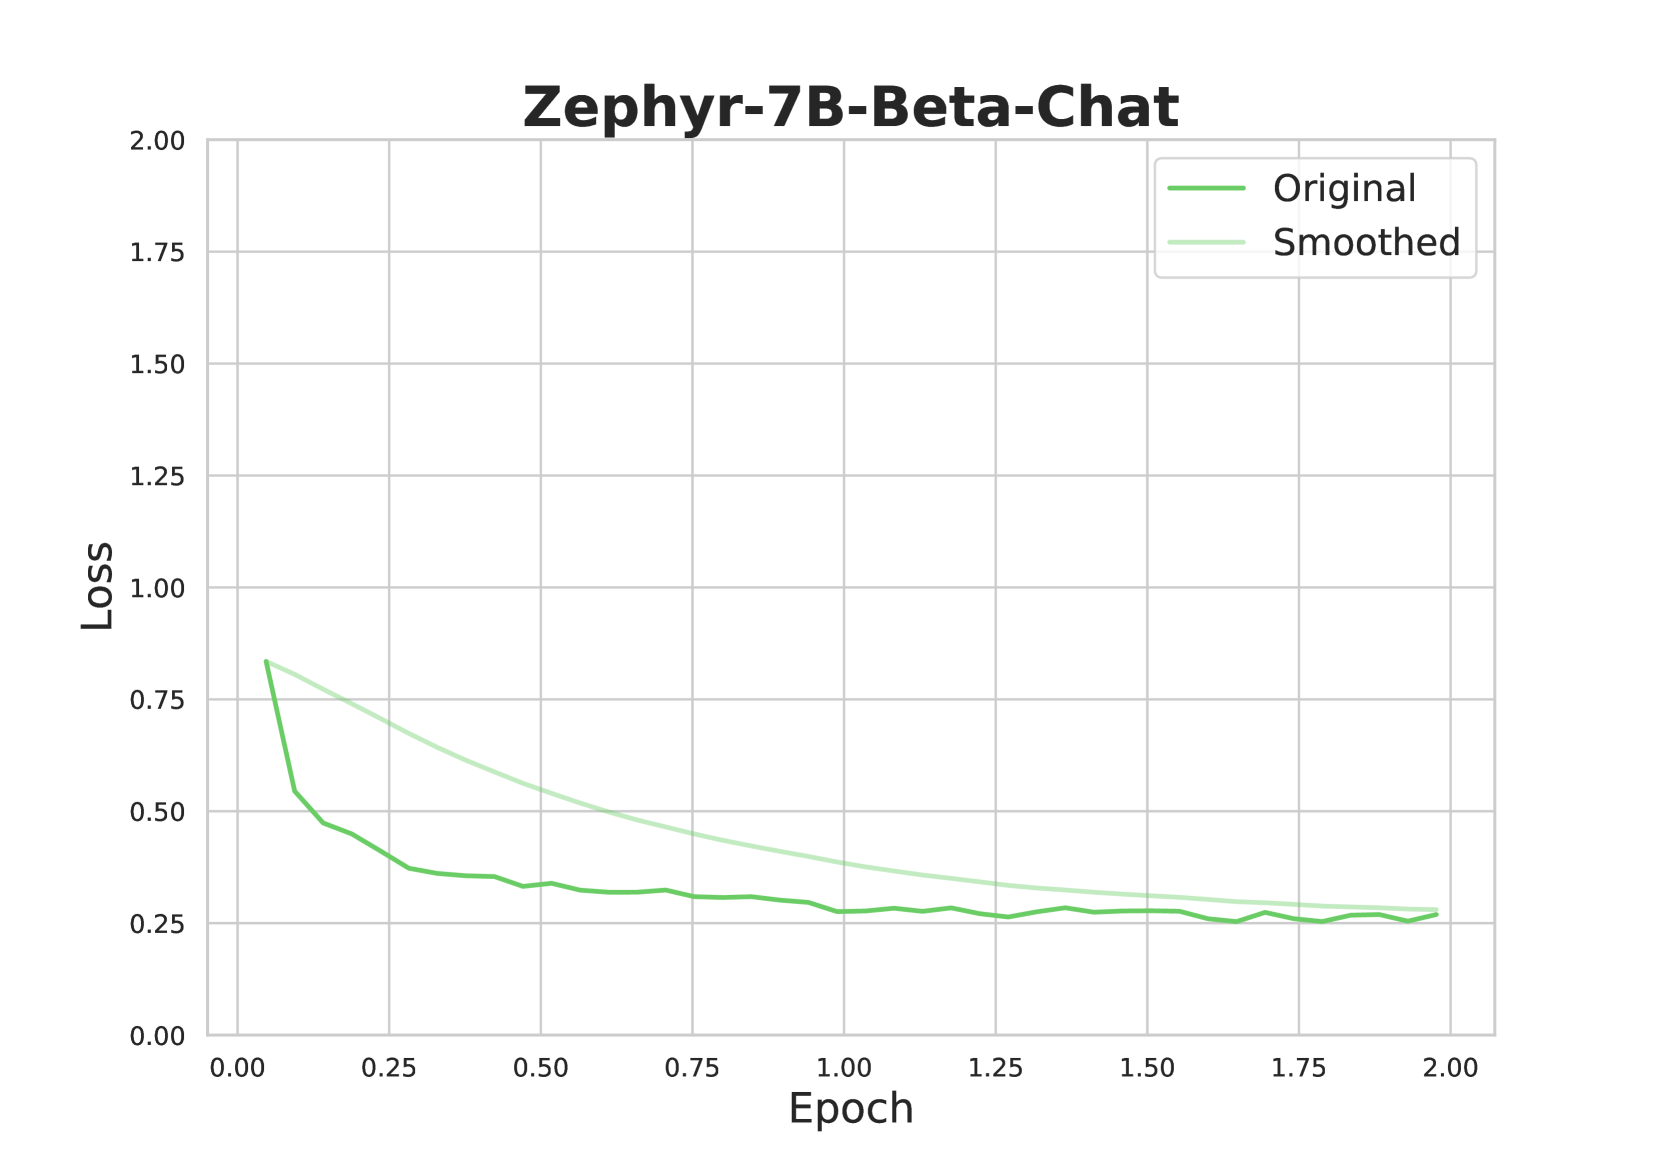
The image is a line chart displaying the loss of the Zephyr-7B-Beta-Chat model over epochs. Two lines are plotted: "Original" and "Smoothed," both showing a decreasing trend in loss as the number of epochs increases.
### Components/Axes
* **Title:** Zephyr-7B-Beta-Chat
* **X-axis:** Epoch, ranging from 0.00 to 2.00 in increments of 0.25.
* **Y-axis:** Loss, ranging from 0.00 to 2.00 in increments of 0.25.
* **Legend:** Located in the top-right corner.
* **Original:** Represented by a solid green line.
* **Smoothed:** Represented by a light green line.
### Detailed Analysis
* **Original (Solid Green Line):**
* **Trend:** The line shows a decreasing trend, indicating a reduction in loss as the number of epochs increases. The decrease is more rapid in the initial epochs and gradually slows down.
* **Data Points:**
* Epoch 0.00: Loss ≈ 0.85
* Epoch 0.25: Loss ≈ 0.45
* Epoch 0.50: Loss ≈ 0.35
* Epoch 1.00: Loss ≈ 0.30
* Epoch 1.50: Loss ≈ 0.27
* Epoch 2.00: Loss ≈ 0.27
* **Smoothed (Light Green Line):**
* **Trend:** Similar to the "Original" line, the "Smoothed" line also shows a decreasing trend. The smoothing effect is evident as the line is less jagged compared to the "Original" line.
* **Data Points:**
* Epoch 0.00: Loss ≈ 0.85
* Epoch 0.25: Loss ≈ 0.65
* Epoch 0.50: Loss ≈ 0.55
* Epoch 1.00: Loss ≈ 0.40
* Epoch 1.50: Loss ≈ 0.32
* Epoch 2.00: Loss ≈ 0.28
### Key Observations
* Both the "Original" and "Smoothed" loss values decrease as the number of epochs increases, indicating that the model is learning.
* The "Smoothed" line is consistently above the "Original" line, suggesting that the smoothing process results in slightly higher loss values at each epoch.
* The rate of decrease in loss diminishes as the number of epochs increases, indicating that the model is approaching a point of diminishing returns.
### Interpretation
The chart illustrates the training progress of the Zephyr-7B-Beta-Chat model. The decreasing loss values over epochs suggest that the model is effectively learning from the training data. The "Smoothed" line provides a clearer view of the overall trend by reducing the noise present in the "Original" data. The convergence of both lines towards a lower loss value indicates that the model is stabilizing and approaching its optimal performance. The diminishing rate of loss reduction suggests that further training may not significantly improve the model's performance.