\n
## Line Chart: Zephyr-7B-Beta-Chat Loss vs. Epoch
### Overview
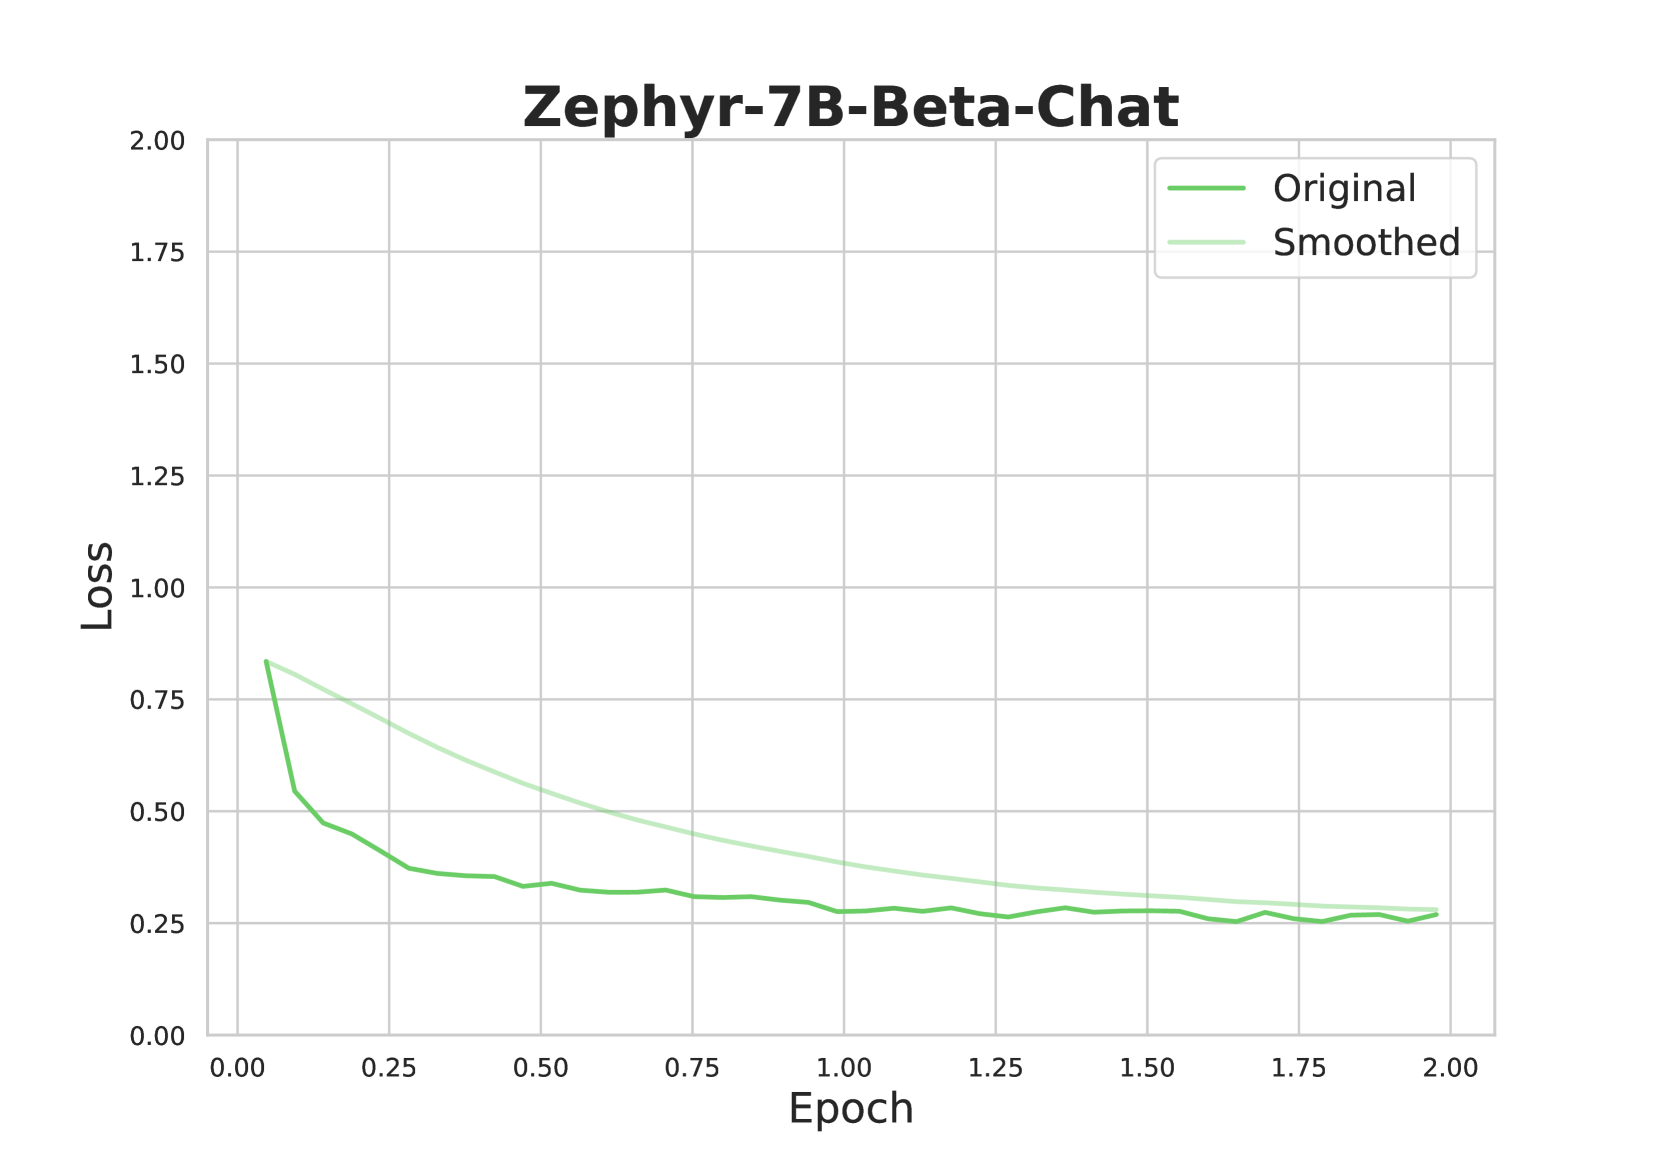
This line chart depicts the loss function of a model named "Zephyr-7B-Beta-Chat" over epochs. Two lines are plotted: one representing the original loss and the other representing a smoothed version of the loss. The chart aims to visualize the model's training progress and stability.
### Components/Axes
* **Title:** Zephyr-7B-Beta-Chat (centered at the top)
* **X-axis:** Epoch (ranging from approximately 0.00 to 2.00)
* **Y-axis:** Loss (ranging from approximately 0.00 to 2.00)
* **Legend:** Located in the top-right corner.
* "Original" (represented by a green line)
* "Smoothed" (represented by a light green line)
* **Gridlines:** Present to aid in reading values.
### Detailed Analysis
The chart shows two lines representing loss over epochs.
**Original Loss (Green Line):**
The line starts at approximately 0.80 at Epoch 0.00. It exhibits a steep downward slope until approximately Epoch 0.25, reaching a value of around 0.30. From Epoch 0.25 to Epoch 1.00, the slope becomes less steep, gradually decreasing to approximately 0.25. Between Epoch 1.00 and Epoch 2.00, the line fluctuates around 0.25, with minor oscillations. Approximate data points:
* Epoch 0.00: Loss = 0.80
* Epoch 0.25: Loss = 0.30
* Epoch 0.50: Loss = 0.27
* Epoch 1.00: Loss = 0.25
* Epoch 1.50: Loss = 0.24
* Epoch 2.00: Loss = 0.25
**Smoothed Loss (Light Green Line):**
The smoothed line starts at approximately 0.75 at Epoch 0.00. It also shows a downward trend, but it is less pronounced than the original line. The smoothed line reaches a value of around 0.25 by Epoch 0.50 and continues to decrease slowly, reaching approximately 0.22 by Epoch 2.00. Approximate data points:
* Epoch 0.00: Loss = 0.75
* Epoch 0.25: Loss = 0.45
* Epoch 0.50: Loss = 0.25
* Epoch 1.00: Loss = 0.23
* Epoch 1.50: Loss = 0.22
* Epoch 2.00: Loss = 0.22
### Key Observations
* Both the original and smoothed loss curves demonstrate a decreasing trend, indicating that the model is learning and improving over epochs.
* The smoothed line is consistently above the original line, suggesting that the smoothing process introduces a slight bias towards higher loss values.
* The original loss curve exhibits more fluctuations than the smoothed curve, indicating that the smoothing process reduces noise and provides a more stable representation of the loss.
* The rate of loss reduction decreases as the number of epochs increases, suggesting that the model is approaching convergence.
### Interpretation
The chart illustrates the training process of the Zephyr-7B-Beta-Chat model. The decreasing loss values indicate that the model is successfully learning to minimize the error between its predictions and the actual values. The smoothed loss curve provides a clearer view of the overall trend, while the original loss curve reveals the inherent noise and fluctuations in the training process. The convergence of both curves towards a stable loss value suggests that the model has reached a point where further training may not yield significant improvements. The difference between the two lines suggests that the smoothing process is effective in reducing noise, but it also introduces a slight bias. This chart is a standard visualization for monitoring the training of machine learning models, and it provides valuable insights into the model's performance and stability.