## Line Chart: Training Loss Curve for Zephyr-7B-Beta-Chat
### Overview
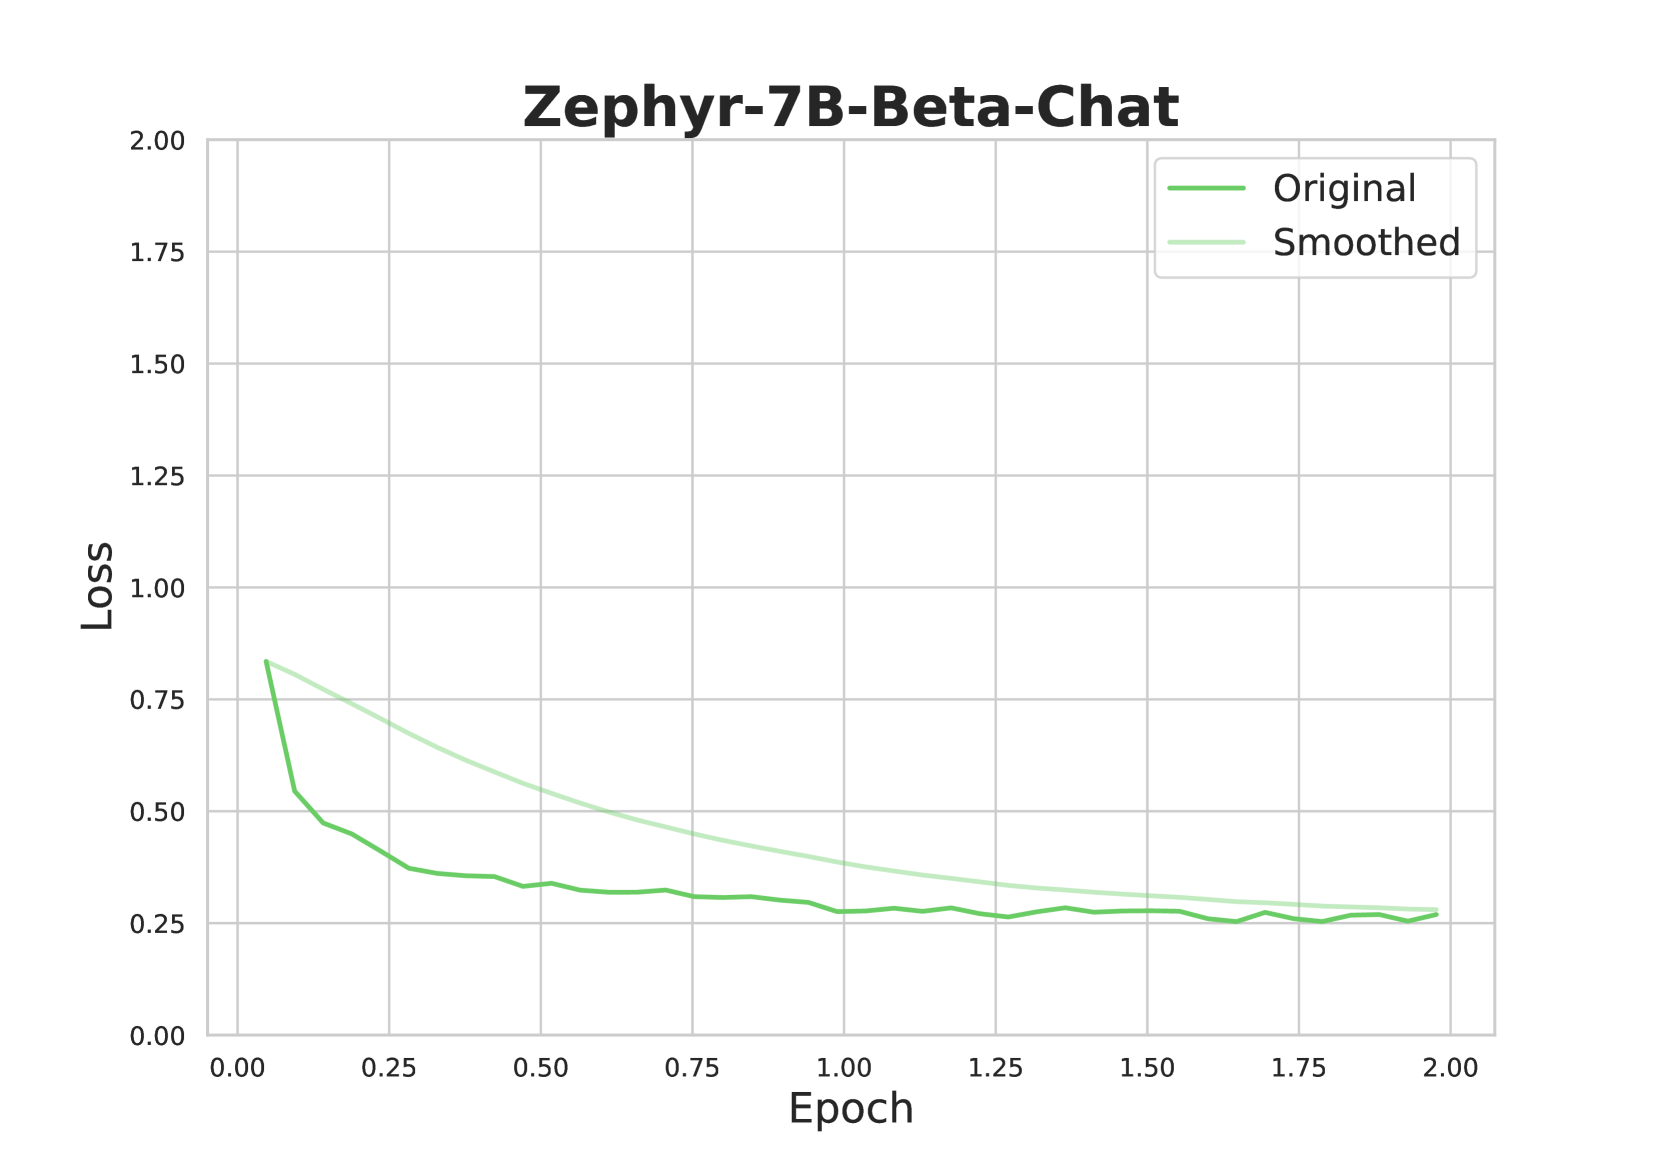
The image displays a line chart titled "Zephyr-7B-Beta-Chat," plotting the training loss of a machine learning model over a series of training epochs. The chart contains two data series: the raw, fluctuating loss values ("Original") and a smoothed version of the same data ("Smoothed"). The overall trend shows a rapid initial decrease in loss, followed by a gradual convergence towards a stable, low value.
### Components/Axes
* **Chart Title:** "Zephyr-7B-Beta-Chat" (centered at the top).
* **Y-Axis (Vertical):**
* **Label:** "Loss" (rotated 90 degrees).
* **Scale:** Linear scale from 0.00 to 2.00.
* **Tick Marks:** Major ticks at intervals of 0.25 (0.00, 0.25, 0.50, 0.75, 1.00, 1.25, 1.50, 1.75, 2.00).
* **X-Axis (Horizontal):**
* **Label:** "Epoch".
* **Scale:** Linear scale from 0.00 to 2.00.
* **Tick Marks:** Major ticks at intervals of 0.25 (0.00, 0.25, 0.50, 0.75, 1.00, 1.25, 1.50, 1.75, 2.00).
* **Legend:**
* **Position:** Top-right corner of the chart area.
* **Entries:**
1. **"Original"**: Represented by a darker green line.
2. **"Smoothed"**: Represented by a lighter, pale green line.
* **Grid:** A light gray grid is present, aligning with the major tick marks on both axes.
### Detailed Analysis
**Data Series & Trends:**
1. **"Original" Line (Darker Green):**
* **Trend:** Starts at a high loss value, experiences a very steep decline within the first ~0.1 epochs, then transitions to a much slower, noisy descent that gradually flattens out.
* **Approximate Data Points:**
* Epoch 0.00: Loss ≈ 0.85
* Epoch 0.10: Loss ≈ 0.55 (sharp drop)
* Epoch 0.25: Loss ≈ 0.45
* Epoch 0.50: Loss ≈ 0.35
* Epoch 1.00: Loss ≈ 0.28
* Epoch 1.50: Loss ≈ 0.27
* Epoch 2.00: Loss ≈ 0.26
* **Character:** The line exhibits small, frequent fluctuations (noise) throughout its descent, which is typical of raw training loss metrics.
2. **"Smoothed" Line (Lighter Green):**
* **Trend:** Starts at the same point as the Original line but follows a smooth, monotonic, and convex decay curve. It consistently lies above the Original line for most of the training process before converging with it near the end.
* **Approximate Data Points:**
* Epoch 0.00: Loss ≈ 0.85
* Epoch 0.25: Loss ≈ 0.65
* Epoch 0.50: Loss ≈ 0.50
* Epoch 1.00: Loss ≈ 0.35
* Epoch 1.50: Loss ≈ 0.28
* Epoch 2.00: Loss ≈ 0.26
* **Character:** This line represents a moving average or similar smoothing function applied to the "Original" data, filtering out high-frequency noise to reveal the underlying trend.
**Spatial Relationship:** The "Smoothed" line acts as a central tendency guide for the "Original" line. The "Original" line oscillates around the "Smoothed" line, with the amplitude of oscillation decreasing as training progresses and the loss stabilizes.
### Key Observations
1. **Rapid Initial Learning:** The most significant reduction in loss (from ~0.85 to ~0.55) occurs within the first 10% of the displayed training period (Epoch 0.00 to 0.10).
2. **Convergence:** Both lines converge to a very similar value (≈0.26) by Epoch 2.00, indicating the training process has likely reached a plateau or a point of diminishing returns.
3. **Noise Reduction:** The "Smoothed" line successfully clarifies the overall trajectory, making it easier to see that the rate of improvement slows considerably after approximately Epoch 0.50.
4. **No Overfitting Signal:** The chart only shows training loss. There is no validation loss curve present to assess for potential overfitting.
### Interpretation
This chart is a standard diagnostic tool for monitoring the training of a neural network, specifically the "Zephyr-7B-Beta-Chat" model. The loss function measures the discrepancy between the model's predictions and the target outputs; a decreasing loss indicates the model is learning from the training data.
The data suggests a successful and stable training run. The steep initial drop is characteristic of the model quickly learning the most obvious patterns in the data. The subsequent slower decline represents the model fine-tuning its parameters to capture more nuanced relationships. The convergence of both the raw and smoothed loss to a low, stable value by epoch 2.00 implies that further training beyond this point, with the current setup, may yield minimal improvement in training loss. The presence of the smoothed line is crucial for interpretation, as it prevents the inherent noise in the raw loss from obscuring the clear, downward trend, confirming that the model's optimization process is functioning as intended.