## Line Chart: Zephyr-7B-Beta-Chat Training Loss
### Overview
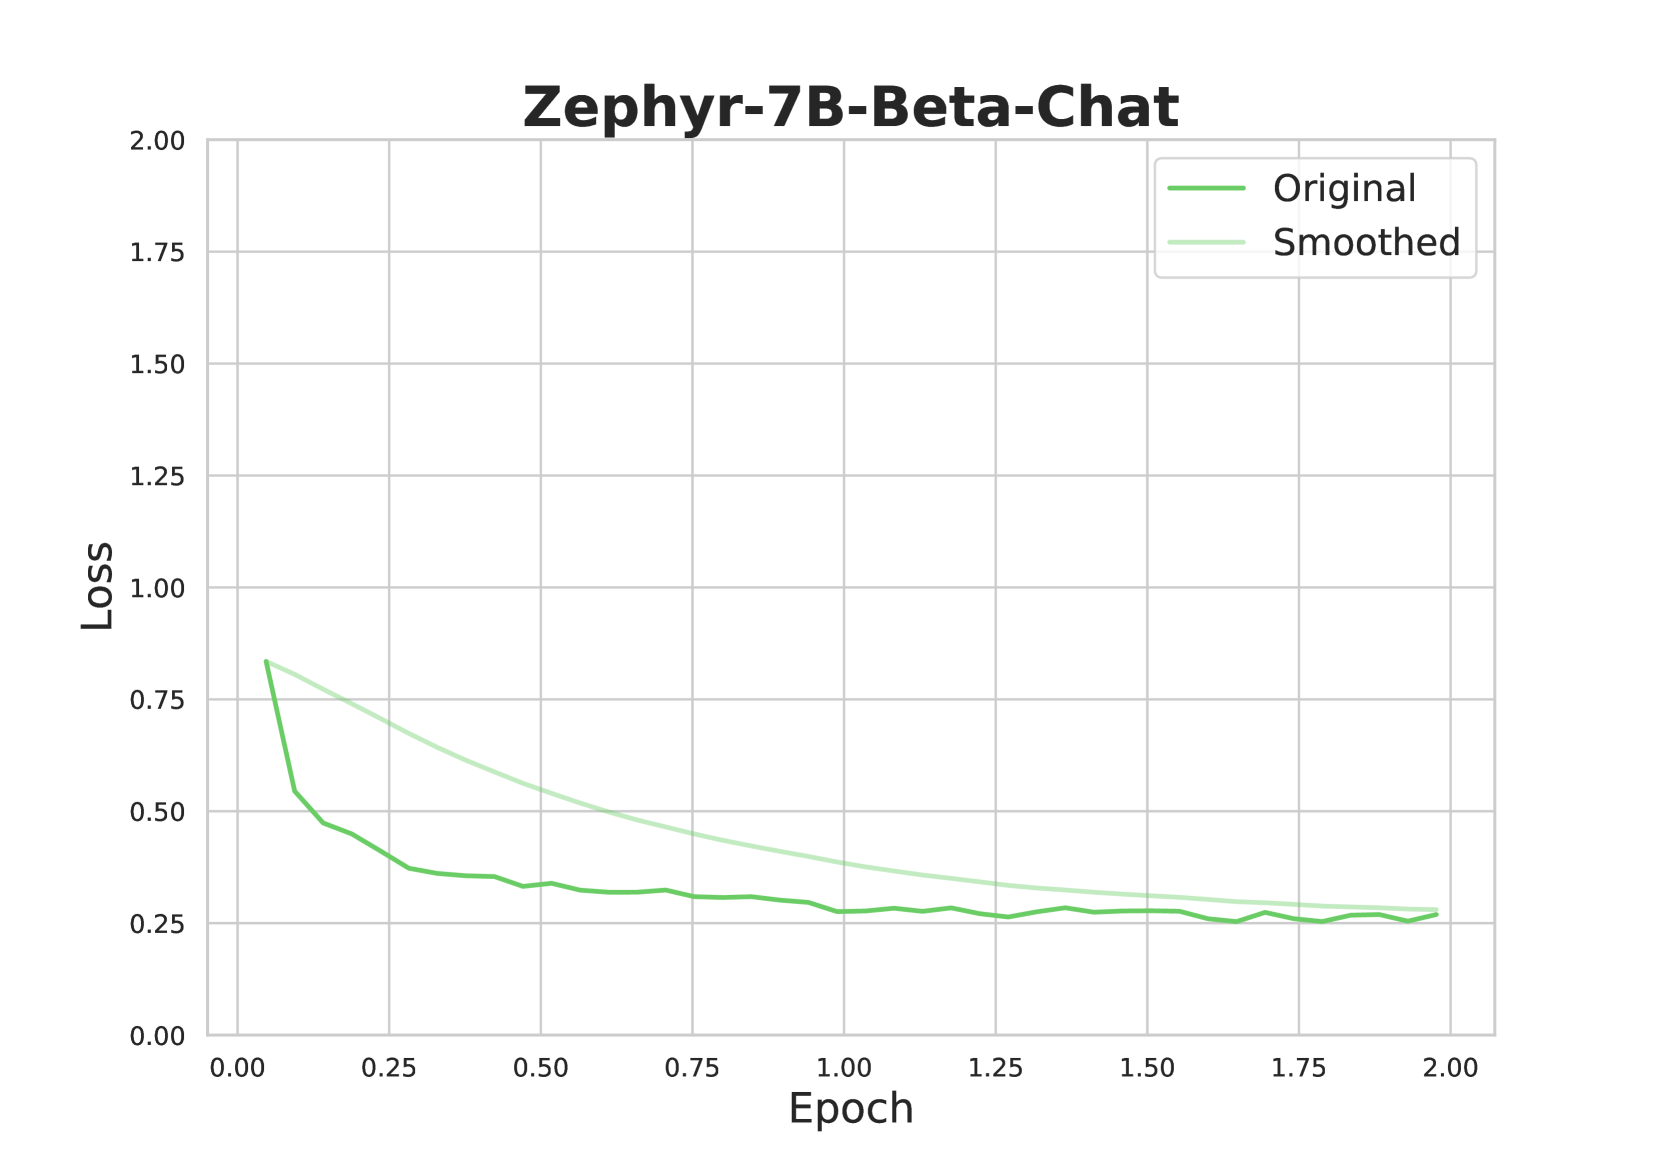
The chart visualizes the training loss of the Zephyr-7B-Beta-Chat model across 2.00 epochs. Two data series are compared: "Original" (green line) and "Smoothed" (light green line). Both lines show a general downward trend in loss, with the Original line exhibiting sharper initial declines and greater volatility compared to the Smoothed line.
### Components/Axes
- **X-axis (Epoch)**: Ranges from 0.00 to 2.00 in increments of 0.25.
- **Y-axis (Loss)**: Ranges from 0.00 to 2.00 in increments of 0.25.
- **Legend**: Located in the top-right corner, with:
- **Green line**: Labeled "Original"
- **Light green line**: Labeled "Smoothed"
### Detailed Analysis
1. **Original Line (Green)**:
- Starts at ~0.8 loss at epoch 0.00.
- Drops sharply to ~0.3 by epoch 0.50.
- Stabilizes between ~0.25–0.3 from epoch 0.75 to 2.00.
- Exhibits minor fluctuations (e.g., slight peaks at epochs 0.75 and 1.25).
2. **Smoothed Line (Light Green)**:
- Begins at ~0.85 loss at epoch 0.00.
- Declines gradually to ~0.25 by epoch 2.00.
- Maintains a smoother trajectory with no sharp drops or spikes.
### Key Observations
- The Original line shows a **steeper initial decline** (~0.8 → 0.3 in 0.5 epochs) compared to the Smoothed line (~0.85 → 0.55 in the same interval).
- Both lines converge to similar loss values (~0.25) by epoch 2.00.
- The Smoothed line demonstrates **lower volatility**, suggesting post-processing or averaging reduced noise in the loss metric.
### Interpretation
The chart indicates that the Zephyr-7B-Beta-Chat model's training loss decreases over time, with the Smoothed line reflecting a more stable and consistent improvement. The Original line's volatility suggests potential overfitting or sensitivity to training dynamics, while the Smoothed line's gradual decline implies effective regularization or averaging techniques. The convergence of both lines at epoch 2.00 highlights that the model stabilizes its performance regardless of smoothing, though the Smoothed line provides a clearer signal of long-term trends.