# Technical Data Extraction: Time-Series Volume Chart
## 1. Document Overview
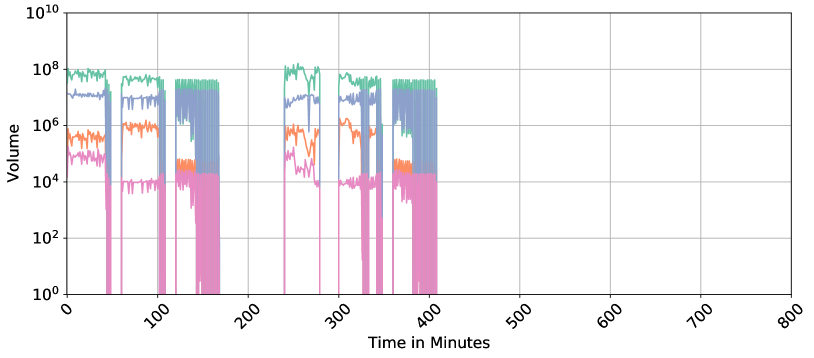
This image is a technical line chart representing "Volume" over "Time in Minutes." The chart utilizes a logarithmic scale for the Y-axis and a linear scale for the X-axis. It tracks four distinct data series (distinguished by color) across a period of 800 minutes.
## 2. Axis and Metadata Extraction
* **Y-Axis Label:** Volume
* **Y-Axis Scale:** Logarithmic ($10^0$ to $10^{10}$)
* **Y-Axis Major Markers:** $10^0, 10^2, 10^4, 10^6, 10^8, 10^{10}$
* **X-Axis Label:** Time in Minutes
* **X-Axis Scale:** Linear (0 to 800)
* **X-Axis Major Markers:** 0, 100, 200, 300, 400, 500, 600, 700, 800 (Labels are rotated approximately 45 degrees).
* **Grid:** Major grid lines are present for both axes.
## 3. Data Series Analysis
There is no explicit legend provided in the image; however, four distinct colored lines are visible. They are analyzed here by color from highest average volume to lowest.
### Series 1: Teal/Green (Highest Volume)
* **Trend:** This series maintains the highest baseline, generally fluctuating between $10^7$ and $10^8$. It operates in distinct bursts.
* **Activity Windows:**
* 0 - ~50 mins: Steady at $\approx 10^8$.
* ~60 - 110 mins: Steady at $\approx 5 \times 10^7$.
* ~120 - 170 mins: High-frequency oscillation between $10^7$ and $10^8$.
* ~240 - 280 mins: Peak activity reaching slightly above $10^8$.
* ~300 - 350 mins: Steady at $\approx 5 \times 10^7$.
* ~360 - 410 mins: High-frequency oscillation.
* **Post-410 mins:** No data/Zero volume.
### Series 2: Blue/Purple (Mid-High Volume)
* **Trend:** Closely follows the teal series but at a lower magnitude, typically between $10^6$ and $10^7$.
* **Activity Windows:** Synchronized with the Teal series. During the oscillatory phases (e.g., 120-170 mins), it shows extreme vertical volatility, dropping down to $10^4$ and spiking back to $10^7$.
* **Post-410 mins:** No data/Zero volume.
### Series 3: Orange (Mid-Low Volume)
* **Trend:** Generally fluctuates between $10^4$ and $10^6$.
* **Activity Windows:**
* 0 - 50 mins: $\approx 5 \times 10^5$.
* 60 - 110 mins: $\approx 10^6$.
* 120 - 170 mins: Drops significantly to $\approx 5 \times 10^4$.
* 240 - 280 mins: Highly volatile, ranging from $10^4$ to $10^6$.
* 300 - 350 mins: $\approx 10^6$.
* 360 - 410 mins: Drops to $\approx 5 \times 10^4$.
* **Post-410 mins:** No data/Zero volume.
### Series 4: Pink/Magenta (Lowest Volume)
* **Trend:** The baseline series, typically fluctuating between $10^3$ and $10^5$.
* **Activity Windows:**
* 0 - 50 mins: $\approx 10^5$.
* 60 - 110 mins: Drops to $\approx 10^4$.
* 120 - 170 mins: Remains at $\approx 10^4$ with significant downward spikes toward $10^0$.
* 240 - 280 mins: $\approx 10^5$ dropping to $10^4$.
* 300 - 350 mins: $\approx 10^4$.
* 360 - 410 mins: $\approx 10^4$ with extreme downward spikes.
* **Post-410 mins:** No data/Zero volume.
## 4. Component Isolation & Observations
* **Header/Title:** None present.
* **Main Chart Area:** The data is clustered in the first half of the timeline (0 to 410 minutes). There are significant "dead zones" or gaps where all volume drops to zero (e.g., between 50-60 mins, 110-120 mins, 170-240 mins, and 280-300 mins).
* **Footer:** Contains the X-axis label "Time in Minutes" and the numerical scale.
* **Data Termination:** All recording or activity appears to cease abruptly at approximately 410 minutes, leaving the remainder of the chart (410-800 minutes) empty.
* **Correlation:** There is a high degree of temporal correlation between the series; when one series is active, they are all active, and they all experience "gap" periods simultaneously.