\n
## Line Chart: Neural Network Performance Comparison
### Overview
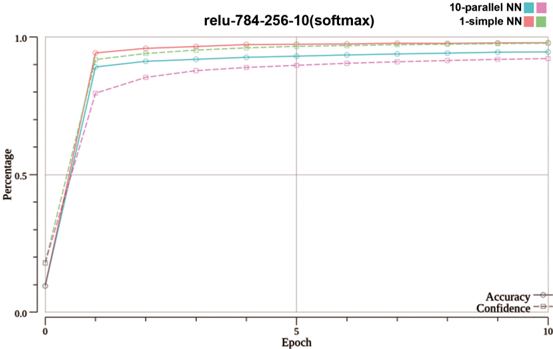
This image presents a line chart comparing the performance of different neural network configurations over epochs. The chart displays both accuracy and confidence as a percentage, plotted against the number of epochs. Three neural network types are compared: a 10-parallel Neural Network (NN), a 1-simple NN, and a baseline. The chart title indicates the network architecture used: "relu-784-256-10(softmax)".
### Components/Axes
* **X-axis:** "Epoch" - ranging from 0 to 10, with gridlines at integer values.
* **Y-axis:** "Percentage" - ranging from 0.0 to 1.0, with gridlines at 0.2, 0.4, 0.6, 0.8, and 1.0.
* **Legend:** Located at the top-right corner of the chart.
* 10-parallel NN (represented by a light purple line with circle markers)
* 1-simple NN (represented by a light blue line with circle markers)
* Accuracy (represented by a solid green line with circle markers)
* Confidence (represented by a dashed black line with circle markers)
* **Title:** "relu-784-256-10(softmax)" - positioned at the top-center of the chart.
### Detailed Analysis
The chart shows the performance of the neural networks over 10 epochs.
* **Accuracy (Green Line):** The accuracy line starts at approximately 0.0 at epoch 0 and rapidly increases to approximately 0.95 by epoch 2. It then plateaus, remaining relatively stable between 0.95 and 0.98 for the remaining epochs (2-10).
* **Confidence (Black Dashed Line):** The confidence line also starts at approximately 0.0 at epoch 0 and increases rapidly, reaching approximately 0.9 by epoch 2. It then plateaus, remaining relatively stable between 0.9 and 0.95 for the remaining epochs (2-10).
* **10-parallel NN (Purple Line):** This line starts at approximately 0.0 at epoch 0 and increases to approximately 0.85 by epoch 2. It then plateaus, remaining relatively stable between 0.85 and 0.9 for the remaining epochs (2-10).
* **1-simple NN (Blue Line):** This line starts at approximately 0.0 at epoch 0 and increases to approximately 0.95 by epoch 2. It then plateaus, remaining relatively stable between 0.95 and 0.98 for the remaining epochs (2-10).
### Key Observations
* Both Accuracy and 1-simple NN achieve the highest performance, reaching approximately 0.98 by epoch 2 and maintaining that level.
* The 10-parallel NN consistently underperforms compared to both Accuracy and 1-simple NN, reaching a maximum of approximately 0.9.
* Confidence closely follows the Accuracy trend, indicating a strong correlation between the two metrics.
* All lines exhibit a steep initial increase in performance within the first two epochs, followed by a plateau.
### Interpretation
The data suggests that the "relu-784-256-10(softmax)" neural network architecture, when trained, quickly achieves high accuracy and confidence. The 1-simple NN configuration performs as well as the accuracy metric, indicating it is a strong performer. The 10-parallel NN, while still achieving good performance, does not reach the same level as the other two configurations. The rapid initial increase in accuracy and confidence suggests that the network learns quickly in the early stages of training. The plateauing of the lines after epoch 2 indicates that the network has likely converged and further training may not yield significant improvements. The correlation between accuracy and confidence suggests that the network is not only making accurate predictions but is also confident in those predictions. The choice of architecture (relu-784-256-10(softmax)) appears to be effective for this particular task, as evidenced by the high accuracy and confidence levels achieved.