## Line Chart: relu-784-256-10(softmax)
### Overview
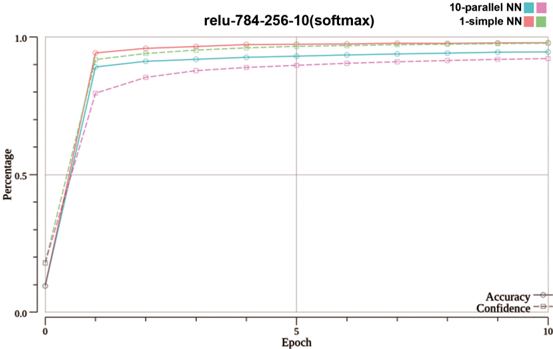
The image is a line chart comparing the training performance of two neural network architectures over 10 epochs. The chart tracks two metrics—Accuracy and Confidence—for each network type. The title "relu-784-256-10(softmax)" suggests the networks use ReLU activation, have an input layer of 784 neurons (likely for 28x28 pixel images), a hidden layer of 256 neurons, an output layer of 10 neurons (for 10 classes), and a softmax final activation.
### Components/Axes
* **Chart Title:** "relu-784-256-10(softmax)" (centered at the top).
* **X-Axis:** Labeled "Epoch". The scale runs from 0 to 10, with major tick marks and labels at 0, 5, and 10.
* **Y-Axis:** Labeled "Percentage". The scale runs from 0.0 to 1.0, with major tick marks and labels at 0.0, 0.5, and 1.0.
* **Legend:** Located in the top-right corner of the chart area. It defines four data series:
* `10-parallel NN` (Cyan color): Represented by a solid line for "Accuracy" and a dashed line for "Confidence".
* `1-simple NN` (Pink color): Represented by a solid line for "Accuracy" and a dashed line for "Confidence".
* **Secondary Legend/Label:** In the bottom-right corner, text clarifies the line styles: "Accuracy" (solid line) and "Confidence" (dashed line).
### Detailed Analysis
The chart shows the progression of Accuracy and Confidence for both networks from epoch 0 to epoch 10.
**1. 10-parallel NN (Cyan Lines):**
* **Accuracy (Solid Cyan Line):** Starts at approximately 0.1 (10%) at epoch 0. It experiences a very steep increase, reaching approximately 0.9 (90%) by epoch 1. The growth then slows, gradually approaching and appearing to plateau just below 1.0 (100%) by epoch 10.
* **Confidence (Dashed Cyan Line):** Follows a nearly identical trajectory to its Accuracy line, starting near 0.1 at epoch 0, jumping to ~0.9 at epoch 1, and plateauing just below 1.0 by epoch 10. The Confidence line is consistently very slightly below the Accuracy line throughout.
**2. 1-simple NN (Pink Lines):**
* **Accuracy (Solid Pink Line):** Starts at approximately 0.1 at epoch 0. It also rises sharply, but to a lower point than the parallel network, reaching approximately 0.8 (80%) by epoch 1. It continues to grow more gradually, plateauing at a level visibly lower than the 10-parallel NN, estimated at around 0.95 (95%) by epoch 10.
* **Confidence (Dashed Pink Line):** Follows a similar pattern to its Accuracy line but is consistently lower. It starts near 0.1, rises to approximately 0.75 at epoch 1, and plateaus at a level lower than its corresponding Accuracy, estimated at around 0.9 (90%) by epoch 10.
**Trend Verification:** All four lines exhibit the same fundamental trend: a rapid, near-vertical ascent in the first epoch, followed by a pronounced "knee" and a long, slow approach to an asymptote (plateau) over the remaining nine epochs. The cyan lines (10-parallel NN) are consistently positioned above their pink counterparts (1-simple NN) for both metrics.
### Key Observations
1. **Dominant Early Learning:** The vast majority of learning for all metrics occurs within the first epoch. The performance gain from epoch 1 to epoch 10 is marginal compared to the gain from epoch 0 to epoch 1.
2. **Performance Hierarchy:** The `10-parallel NN` architecture consistently outperforms the `1-simple NN` architecture on both Accuracy and Confidence metrics across all epochs after initialization.
3. **Metric Relationship:** For both network types, the Confidence metric closely tracks but remains slightly below the Accuracy metric throughout training.
4. **Convergence:** All four curves appear to have fully converged by epoch 10, showing no significant upward trend in the final epochs.
### Interpretation
This chart demonstrates the comparative training efficiency and final performance of two neural network models on a classification task (implied by the 10-class softmax output).
* **Architectural Impact:** The "10-parallel NN" likely refers to an ensemble or a parallelized model, which shows a clear advantage over the "1-simple NN" (a single, standard network). This suggests that model parallelism or ensembling provides a significant boost in both final accuracy and the model's confidence in its predictions for this task.
* **Learning Dynamics:** The extremely rapid initial learning suggests the task is relatively straightforward for these architectures once training begins, or that the learning rate is high. The long plateau indicates that further training beyond a few epochs yields diminishing returns.
* **Confidence vs. Accuracy:** The fact that Confidence is slightly lower than Accuracy for both models is a positive sign. It suggests the models are not overly confident; their predicted probability distributions (confidence) are well-calibrated with their actual correct prediction rate (accuracy). A model where confidence greatly exceeds accuracy would be overconfident and poorly calibrated.
* **Underlying Task:** Given the input dimension of 784 and 10 output classes, this is almost certainly a performance chart for training on the MNIST handwritten digit dataset or a similar task. The high final accuracy (>95%) is consistent with state-of-the-art results on MNIST.