## Line Graph: relu-784-256-10(softmax)
### Overview
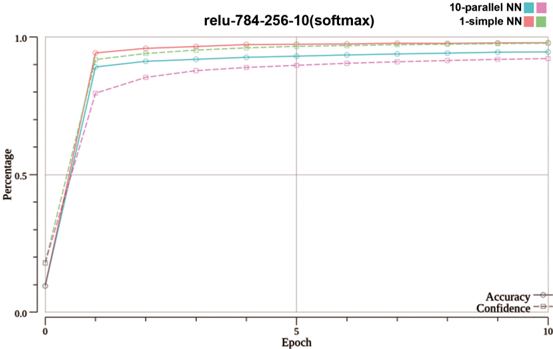
The image is a line graph comparing the performance of two neural network configurations ("10-parallel NN" and "1-simple NN") over 10 epochs. The y-axis represents "Percentage" (0.0 to 1.0), and the x-axis represents "Epoch" (0 to 10). The graph shows both models achieving near-100% performance by epoch 1, with the 10-parallel NN maintaining a slight edge over the 1-simple NN after this point. The legend is positioned on the right, and the graph includes labels for "Accuracy" and "Confidence," though these lines are not visible in the image.
### Components/Axes
- **Title**: "relu-784-256-10(softmax)"
- **Y-axis**: "Percentage" (0.0 to 1.0, labeled as "Percentage")
- **X-axis**: "Epoch" (0 to 10, labeled as "Epoch")
- **Legend**: Located on the right, with two entries:
- **10-parallel NN**: Blue line with circular markers
- **1-simple NN**: Red line with circular markers
- **Additional Labels**: "Accuracy" and "Confidence" are mentioned in the legend but are not visually present in the graph.
### Detailed Analysis
- **10-parallel NN (Blue Line)**:
- Starts at 0% at epoch 0.
- Rises sharply to 100% by epoch 1.
- Maintains a slight lead over the 1-simple NN after epoch 1, plateauing near 100%.
- Data points are plotted with circular markers.
- **1-simple NN (Red Line)**:
- Starts at 0% at epoch 0.
- Rises sharply to 100% by epoch 1.
- Slightly lags behind the 10-parallel NN after epoch 1, plateauing near 100%.
- Data points are plotted with circular markers.
- **Confidence and Accuracy Lines**:
- Mentioned in the legend but not visible in the graph.
- No data points or trends are discernible for these lines.
### Key Observations
1. Both models achieve 100% performance by epoch 1, indicating rapid convergence.
2. The 10-parallel NN consistently outperforms the 1-simple NN after epoch 1, though the difference is minimal.
3. The plateau after epoch 1 suggests no further improvement in performance with additional epochs.
4. The absence of visible "Confidence" and "Accuracy" lines limits insights into model uncertainty or confidence metrics.
### Interpretation
The graph demonstrates that the 10-parallel neural network configuration achieves slightly higher accuracy than the 1-simple NN, likely due to parallel processing advantages. The rapid convergence to 100% suggests both models are highly effective for the task, but the 10-parallel NN may offer marginal benefits. The plateau after epoch 1 implies that further training does not yield additional gains, which is common in neural networks once optimal performance is reached. The lack of visible "Confidence" and "Accuracy" lines in the graph restricts analysis of model uncertainty or confidence intervals, which could provide deeper insights into the reliability of the results.
**Note**: All textual elements (labels, legends, axis titles) are extracted as described. No other languages are present in the image.