\n
## Diagram: Neural Network Activity Visualization
### Overview
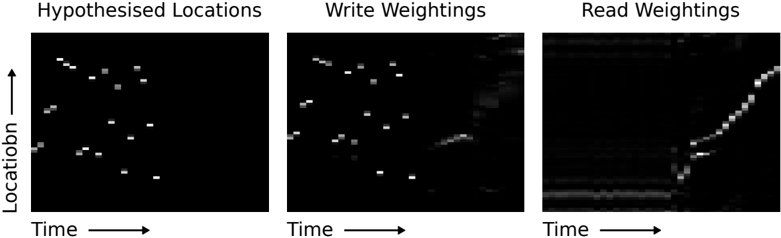
The image presents three sequential visualizations of activity within a neural network, likely during a learning or processing phase. Each visualization is a 2D representation with axes labeled "Time" and "Location", and a title indicating the type of activity being displayed: "Hypothesised Locations", "Write Weightings", and "Read Weightings". The visualizations appear as heatmaps, where brighter pixels indicate higher activity levels.
### Components/Axes
* **X-axis:** Labeled "Time", running horizontally.
* **Y-axis:** Labeled "Location", running vertically.
* **Visualizations:** Three panels, each representing a different stage or aspect of neural network operation.
* "Hypothesised Locations" - Shows scattered bright points.
* "Write Weightings" - Shows scattered bright points, some with faint trails.
* "Read Weightings" - Shows a concentrated, diagonal band of bright points.
### Detailed Analysis or Content Details
The visualizations are essentially pixelated heatmaps. It's difficult to extract precise numerical values without knowing the scale or resolution of the "Time" and "Location" axes. However, we can describe the distribution of activity:
**1. Hypothesised Locations:**
* The bright points are scattered relatively evenly across the "Location" axis.
* The points are distributed across the "Time" axis, but there doesn't appear to be a strong temporal trend.
* Approximately 10-15 bright points are visible.
* The points are roughly square in shape, suggesting a uniform pixel size.
**2. Write Weightings:**
* Similar to "Hypothesised Locations", bright points are scattered.
* Some points exhibit faint trails or streaks, suggesting a brief duration of activity or a gradual change in weighting.
* Approximately 10-15 bright points are visible.
* The distribution appears slightly more concentrated towards the upper portion of the "Location" axis.
**3. Read Weightings:**
* A distinct diagonal band of bright points is visible, extending from the bottom-left to the top-right of the visualization.
* The band indicates a strong correlation between "Time" and "Location". As time progresses, activity shifts to higher "Location" values.
* The band is significantly more concentrated than the scattered points in the previous visualizations.
* Approximately 20-30 bright points are visible within the band.
### Key Observations
* The activity pattern changes significantly across the three visualizations.
* "Hypothesised Locations" and "Write Weightings" show dispersed activity, while "Read Weightings" exhibits a clear directional trend.
* The diagonal band in "Read Weightings" suggests a sequential activation or processing of locations over time.
* The faint trails in "Write Weightings" suggest a dynamic process of adjusting weights.
### Interpretation
This diagram likely illustrates the internal workings of a neural network, potentially during a reinforcement learning or sequential processing task.
* **"Hypothesised Locations"** could represent the network's initial exploration or prediction of relevant locations for processing.
* **"Write Weightings"** could show the process of updating the network's internal parameters (weights) based on the hypothesized locations. The trails suggest that the weight adjustments are not instantaneous.
* **"Read Weightings"** likely represents the network's actual processing of information, where activity propagates sequentially through different locations. The diagonal band indicates that the network is systematically attending to locations in a specific order.
The transition from scattered activity in the first two visualizations to the directional band in the third suggests that the network is learning to focus its attention and process information in a more efficient and organized manner. The diagram provides a visual representation of how the network's internal state evolves over time, revealing the dynamic interplay between exploration, learning, and processing. The lack of numerical data makes it difficult to quantify the network's performance or learning rate, but the visual trends provide valuable insights into its behavior.