## Heatmap Series: Memory System Weightings
### Overview
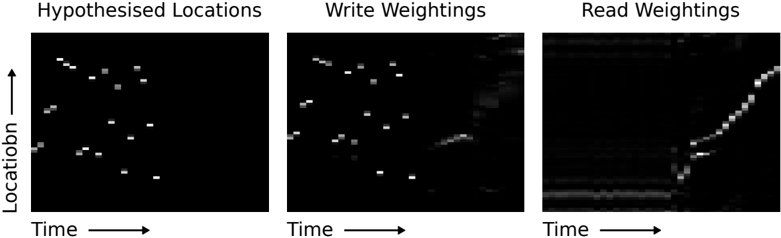
The image displays three horizontally aligned heatmap panels, each visualizing a different aspect of a system's activity over time and across discrete locations. The panels are titled "Hypothesised Locations," "Write Weightings," and "Read Weightings." All three share identical axes, suggesting they represent different data series for the same spatiotemporal framework. The visualization uses a grayscale intensity map where brighter pixels (white/light gray) indicate higher values or activity against a black background (zero or low activity).
### Components/Axes
* **Titles (Top of each panel, left to right):**
1. Hypothesised Locations
2. Write Weightings
3. Read Weightings
* **Y-Axis (Left side of the leftmost panel, applies to all):**
* Label: `Location` (with an upward-pointing arrow `↑`).
* Scale: Not numerically labeled. Represents a set of discrete, categorical locations or memory slots arranged vertically.
* **X-Axis (Bottom of each panel):**
* Label: `Time` (with a rightward-pointing arrow `→`).
* Scale: Not numerically labeled. Represents a continuous or discrete progression from left (earlier) to right (later).
* **Data Representation:** Grayscale intensity. No explicit color bar or legend is provided. Brightness is the sole indicator of magnitude.
### Detailed Analysis
**Panel 1: Hypothesised Locations**
* **Visual Trend:** Sparse, isolated bright pixels scattered across the black field. There is no obvious geometric pattern or strong correlation between location and time.
* **Data Points:** Approximately 20-25 distinct bright pixels are visible. They appear at various (Location, Time) coordinates without forming lines or clusters. For example, a bright pixel appears near the top-left, another near the bottom-center, etc. This suggests discrete, potentially noisy or uncertain predictions of where an event or memory is located at specific times.
**Panel 2: Write Weightings**
* **Visual Trend:** More activity than the first panel. Shows two distinct patterns:
1. A sparse scattering of bright pixels in the left and central regions, somewhat similar to but denser than the "Hypothesised Locations" panel.
2. A concentrated, bright, cloud-like cluster in the **right portion** of the panel, spanning multiple locations. This indicates a period of intense "writing" or updating activity focused on a specific time window.
* **Data Points:** The left/central scatter contains roughly 15-20 bright pixels. The right-side cluster is a dense region of high intensity, making individual points indistinguishable.
**Panel 3: Read Weightings**
* **Visual Trend:** A striking, well-defined diagonal line of bright pixels running from the **bottom-left** to the **top-right** of the panel. The line is not perfectly straight but has a clear positive slope. Faint horizontal streaks are also visible in the background.
* **Data Points:** The primary feature is the diagonal line, composed of approximately 25-30 closely spaced bright pixels. This demonstrates a strong, consistent relationship: as time progresses (x-axis increases), the location being "read" from also increases (y-axis increases). The faint horizontal lines suggest minor, constant activity at specific locations across all times.
### Key Observations
1. **Progression of Structure:** The panels show a clear evolution from sparse, unstructured data ("Hypothesised Locations") to a highly structured, linear relationship ("Read Weightings").
2. **Temporal Focus of Writing:** The "Write Weightings" panel shows that the system's update activity is not uniform; it has a period of concentrated activity in the latter time segment.
3. **Diagonal Read Pattern:** The most significant feature is the diagonal in the "Read Weightings" panel. This is a classic signature of a perfectly ordered or sequential access pattern over time.
4. **Lack of Numerical Scales:** The absence of numerical labels on the axes means all analysis is qualitative and relative. We cannot determine the absolute number of locations or the time units.
### Interpretation
This image likely visualizes the internal state of a **neural memory system** or a **content-addressable memory model** (like a Hopfield network or a transformer's key-value memory) during a task.
* **Hypothesised Locations** may represent the initial, noisy guesses or attention weights about where relevant information is stored in memory.
* **Write Weightings** show how the system updates its memory. The intense cluster on the right suggests a critical learning or encoding event happening at that time, possibly consolidating information into a specific memory format.
* **Read Weightings** reveal how the system retrieves information. The perfect diagonal indicates that retrieval has become **perfectly systematic and sequential**. At each time step, the system reads from the memory location corresponding exactly to that time step's index. This suggests the memory has been organized into a perfect, ordered queue or tape, where information is stored and retrieved in the exact sequence it was encountered.
**Overall Meaning:** The data demonstrates a system transitioning from uncertain, parallel hypotheses about memory location to a perfectly ordered, sequential read-out mechanism. The "write" operation appears to be the catalyst that organizes the memory into this linear structure. This is a fundamental pattern in systems that learn to store and recall sequences, such as in certain types of recurrent neural networks or differentiable neural computers. The outlier is the initial "Hypothesised Locations" state, which lacks the order that is fully established by the final "Read" phase.