TECHNICAL ASSET FINGERPRINT
2c4acacf249fcc86b8f3e083
Click to view fullscreen
Press ESC or click to close
FOUND IN PAPERS
EXPERT: healer-alpha-free VERSION 1
RUNTIME: free/openrouter/healer-alpha
INTEL_VERIFIED
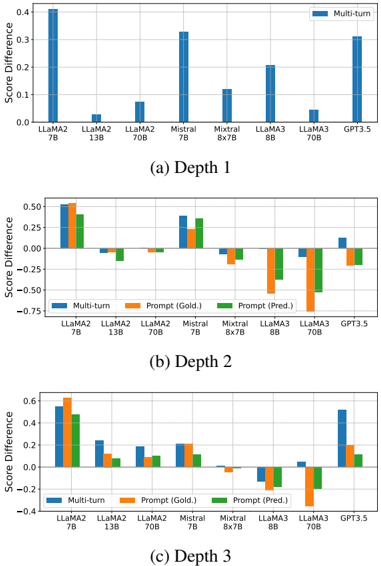
## Bar Charts: Multi-turn and Prompt Score Differences Across LLMs at Three Depths
### Overview
The image contains three separate bar charts arranged vertically, labeled (a) Depth 1, (b) Depth 2, and (c) Depth 3. Each chart compares the "Score Difference" for eight different Large Language Models (LLMs). Chart (a) shows only a "Multi-turn" series, while charts (b) and (c) include three series: "Multi-turn," "Prompt (Gold.)," and "Prompt (Pred.)." The charts appear to evaluate model performance, likely in a conversational or reasoning task, where a positive score difference indicates improvement or a favorable outcome.
### Components/Axes
* **Chart Type:** Grouped Bar Charts.
* **Y-Axis (All Charts):** Label is "Score Difference." The scale varies slightly between charts.
* Chart (a): 0.0 to 0.4, with increments of 0.1.
* Chart (b): -0.75 to 0.50, with increments of 0.25.
* Chart (c): -0.4 to 0.6, with increments of 0.2.
* **X-Axis (All Charts):** Lists eight LLM models. The order is consistent:
1. LLaMA2 7B
2. LLaMA2 13B
3. LLaMA2 70B
4. Mistral 7B
5. Mixtral 8x7B
6. LLaMA3 8B
7. LLaMA3 70B
8. GPT3.5
* **Legend:**
* Chart (a): Single series "Multi-turn" (blue). Legend is in the top-right corner.
* Charts (b) & (c): Three series. Legend is centered at the top of the chart area.
* "Multi-turn" (blue)
* "Prompt (Gold.)" (orange)
* "Prompt (Pred.)" (green)
### Detailed Analysis
#### Chart (a) Depth 1
* **Data Series:** Only "Multi-turn" (blue bars).
* **Approximate Values (Score Difference):**
* LLaMA2 7B: ~0.40
* LLaMA2 13B: ~0.05
* LLaMA2 70B: ~0.08
* Mistral 7B: ~0.33
* Mixtral 8x7B: ~0.12
* LLaMA3 8B: ~0.20
* LLaMA3 70B: ~0.05
* GPT3.5: ~0.32
* **Trend:** All values are positive. LLaMA2 7B shows the highest score difference, followed closely by Mistral 7B and GPT3.5. LLaMA2 13B and LLaMA3 70B show the smallest positive differences.
#### Chart (b) Depth 2
* **Data Series:** "Multi-turn" (blue), "Prompt (Gold.)" (orange), "Prompt (Pred.)" (green).
* **Approximate Values (Score Difference):**
* **LLaMA2 7B:** Multi-turn ~0.50, Prompt (Gold.) ~0.55, Prompt (Pred.) ~0.45. All positive.
* **LLaMA2 13B:** Multi-turn ~ -0.05, Prompt (Gold.) ~0.00, Prompt (Pred.) ~ -0.15. Mixed signs.
* **LLaMA2 70B:** Multi-turn ~0.00, Prompt (Gold.) ~ -0.05, Prompt (Pred.) ~0.00. Near zero.
* **Mistral 7B:** Multi-turn ~0.40, Prompt (Gold.) ~0.30, Prompt (Pred.) ~0.38. All positive.
* **Mixtral 8x7B:** Multi-turn ~ -0.15, Prompt (Gold.) ~ -0.10, Prompt (Pred.) ~ -0.20. All negative.
* **LLaMA3 8B:** Multi-turn ~ -0.10, Prompt (Gold.) ~ -0.65, Prompt (Pred.) ~ -0.40. All negative.
* **LLaMA3 70B:** Multi-turn ~ -0.05, Prompt (Gold.) ~ -0.75, Prompt (Pred.) ~ -0.55. All negative, with Prompt (Gold.) showing the largest negative difference in the chart.
* **GPT3.5:** Multi-turn ~0.15, Prompt (Gold.) ~ -0.20, Prompt (Pred.) ~ -0.25. Mixed signs.
* **Trend:** Performance is highly variable. LLaMA2 7B and Mistral 7B maintain positive scores across all series. LLaMA3 models (8B and 70B) and Mixtral 8x7B show notably negative score differences, especially for the prompt-based evaluations.
#### Chart (c) Depth 3
* **Data Series:** "Multi-turn" (blue), "Prompt (Gold.)" (orange), "Prompt (Pred.)" (green).
* **Approximate Values (Score Difference):**
* **LLaMA2 7B:** Multi-turn ~0.50, Prompt (Gold.) ~0.65, Prompt (Pred.) ~0.48. All positive and high.
* **LLaMA2 13B:** Multi-turn ~0.25, Prompt (Gold.) ~0.10, Prompt (Pred.) ~0.12. All positive.
* **LLaMA2 70B:** Multi-turn ~0.18, Prompt (Gold.) ~0.10, Prompt (Pred.) ~0.02. All positive but smaller.
* **Mistral 7B:** Multi-turn ~0.20, Prompt (Gold.) ~0.18, Prompt (Pred.) ~0.05. All positive.
* **Mixtral 8x7B:** Multi-turn ~0.00, Prompt (Gold.) ~ -0.10, Prompt (Pred.) ~0.00. Mixed/near zero.
* **LLaMA3 8B:** Multi-turn ~ -0.15, Prompt (Gold.) ~ -0.10, Prompt (Pred.) ~ -0.20. All negative.
* **LLaMA3 70B:** Multi-turn ~0.05, Prompt (Gold.) ~ -0.40, Prompt (Pred.) ~0.00. Mixed signs.
* **GPT3.5:** Multi-turn ~0.50, Prompt (Gold.) ~0.20, Prompt (Pred.) ~0.10. All positive.
* **Trend:** LLaMA2 7B again shows the strongest positive performance. Most models show positive or near-zero scores, except LLaMA3 8B which remains negative across all series. The gap between "Prompt (Gold.)" and "Prompt (Pred.)" is often smaller than in Depth 2.
### Key Observations
1. **Consistent Top Performer:** LLaMA2 7B consistently shows the highest or near-highest positive score difference across all three depths and all evaluation types (Multi-turn, Prompt Gold/Pred).
2. **Depth-Dependent Degradation:** Several models (e.g., LLaMA3 8B, Mixtral 8x7B) show a shift from positive scores at Depth 1 to negative scores at Depths 2 and 3, particularly for prompt-based evaluations.
3. **Prompt Evaluation Volatility:** The "Prompt (Gold.)" and "Prompt (Pred.)" series show much greater variance (both positive and negative) compared to the "Multi-turn" series, especially at Depth 2.
4. **Model Family Trends:** Within the LLaMA2 family, the 7B model outperforms the larger 13B and 70B models in this specific metric. The LLaMA3 models generally underperform compared to their LLaMA2 counterparts in these charts.
5. **GPT3.5 Performance:** GPT3.5 shows positive Multi-turn scores at all depths but has mixed/negative results for prompt evaluations at Depth 2.
### Interpretation
The data suggests that the evaluated task becomes more challenging or changes in nature as "Depth" increases from 1 to 3. The "Score Difference" metric likely measures performance relative to a baseline.
* **Robustness of Multi-turn Evaluation:** The "Multi-turn" evaluation appears more stable and less prone to large negative swings across models and depths compared to the single-turn "Prompt" evaluations. This could indicate that conversational context helps stabilize model performance.
* **Impact of Prompt Quality:** The divergence between "Prompt (Gold.)" (likely using a human-crafted, optimal prompt) and "Prompt (Pred.)" (likely using a model-generated or predicted prompt) highlights the sensitivity of LLM performance to prompt engineering. At Depth 2, this gap is particularly large for models like LLaMA3 70B.
* **Model Scaling Anomaly:** The underperformance of larger models (LLaMA2 70B, LLaMA3 70B) compared to smaller ones (LLaMA2 7B) in several instances is notable. This could suggest that for this specific task, larger model scale does not guarantee better performance, or that the larger models are more susceptible to the difficulties introduced at greater depths.
* **Task-Specific Insights:** The charts are likely from a study on multi-hop reasoning, complex dialogue, or a task requiring sequential understanding (hence "Depth"). The negative scores at higher depths for some models indicate they are performing worse than the baseline, possibly failing to maintain coherence or accuracy as complexity increases.
**Language Note:** All text in the image is in English.
DECODING INTELLIGENCE...