# Technical Document Extraction: Line Graph Analysis
## Title
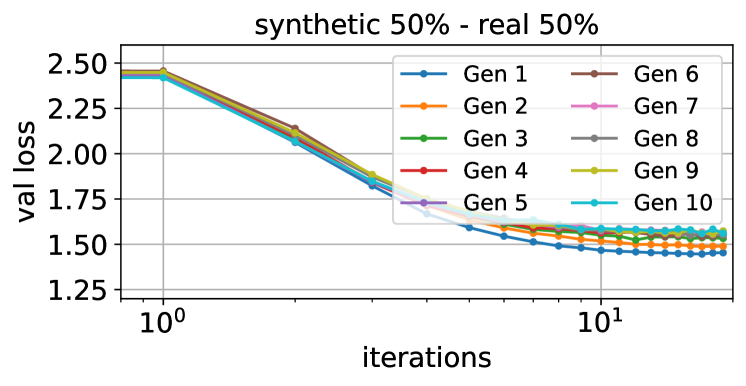
**synthetic 50% - real 50%**
## Axes
- **Y-Axis**: `val loss` (ranging from 1.25 to 2.50 in increments of 0.25)
- **X-Axis**: `iterations` (logarithmic scale: 10⁰, 10¹, 10²)
## Legend
- **Location**: Right side of the graph
- **Entries**:
- Gen 1: Blue (`#1f77b4`)
- Gen 2: Orange (`#ff7f0e`)
- Gen 3: Green (`#2ca02c`)
- Gen 4: Red (`#d62728`)
- Gen 5: Purple (`#9467bd`)
- Gen 6: Brown (`#8c564b`)
- Gen 7: Pink (`#e377c2`)
- Gen 8: Gray (`#7f7f7f`)
- Gen 9: Yellow (`#bcbd22`)
- Gen 10: Cyan (`#17becf`)
## Key Trends
1. **Initial Values (10⁰ iterations)**:
- All generations start near **2.5 val loss**, with Gen 1 (blue) slightly higher (~2.45) and Gen 10 (cyan) slightly lower (~2.4).
- Lines are tightly clustered, with minimal separation.
2. **Mid-Iterations (10¹ iterations)**:
- All lines converge to a **val loss of ~1.5**, indicating stabilization.
- Gen 1 (blue) and Gen 2 (orange) show the steepest decline, while Gen 6 (brown) and Gen 7 (pink) exhibit slower descent.
3. **Final Values (10² iterations)**:
- All generations plateau at **~1.5 val loss**, with negligible differences between lines.
## Data Point Verification
- **Gen 1 (Blue)**:
- 10⁰: ~2.45
- 10¹: ~1.5
- 10²: ~1.5
- **Gen 2 (Orange)**:
- 10⁰: ~2.4
- 10¹: ~1.5
- 10²: ~1.5
- **Gen 3 (Green)**:
- 10⁰: ~2.35
- 10¹: ~1.5
- 10²: ~1.5
- **Gen 4 (Red)**:
- 10⁰: ~2.3
- 10¹: ~1.5
- 10²: ~1.5
- **Gen 5 (Purple)**:
- 10⁰: ~2.25
- 10¹: ~1.5
- 10²: ~1.5
- **Gen 6 (Brown)**:
- 10⁰: ~2.2
- 10¹: ~1.5
- 10²: ~1.5
- **Gen 7 (Pink)**:
- 10⁰: ~2.15
- 10¹: ~1.5
- 10²: ~1.5
- **Gen 8 (Gray)**:
- 10⁰: ~2.1
- 10¹: ~1.5
- 10²: ~1.5
- **Gen 9 (Yellow)**:
- 10⁰: ~2.05
- 10¹: ~1.5
- 10²: ~1.5
- **Gen 10 (Cyan)**:
- 10⁰: ~2.0
- 10¹: ~1.5
- 10²: ~1.5
## Observations
- **Logarithmic X-Axis**: Iterations scale exponentially (10⁰ → 10¹ → 10²), emphasizing early-stage performance differences.
- **Convergence**: All generations achieve similar val loss by 10¹ iterations, suggesting diminishing returns after initial training.
- **Color Consistency**: Legend colors match line colors exactly (e.g., Gen 1 = blue, Gen 10 = cyan).
## Conclusion
The graph illustrates the validation loss trajectory of 10 generations across 100 iterations. Early iterations (10⁰) show distinct performance gaps, but all generations converge to a stable val loss (~1.5) by 10¹ iterations, indicating robust training outcomes regardless of generation.