## Line Charts: F1 Score vs. Hypervector Dimension for WebQSP, CWQ, and GrailQA
### Overview
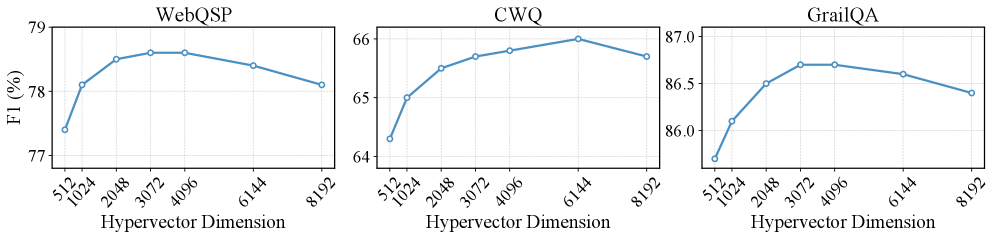
The image presents three line charts side-by-side, each displaying the relationship between the F1 score (in percentage) and the hypervector dimension for different datasets: WebQSP, CWQ, and GrailQA. The x-axis represents the hypervector dimension, with values ranging from 512 to 8192. The y-axis represents the F1 score, with different ranges for each dataset.
### Components/Axes
* **Titles:**
* Left Chart: WebQSP
* Middle Chart: CWQ
* Right Chart: GrailQA
* **X-Axis (Horizontal):**
* Label: Hypervector Dimension
* Values: 512, 1024, 2048, 3072, 4096, 6144, 8192
* **Y-Axis (Vertical):**
* Label: F1 (%)
* Left Chart (WebQSP): Range approximately 77% to 79%
* Ticks: 77, 78, 79
* Middle Chart (CWQ): Range approximately 64% to 66%
* Ticks: 64, 65, 66
* Right Chart (GrailQA): Range approximately 86.0% to 87.0%
* Ticks: 86.0, 86.5, 87.0
* **Data Series:** Each chart contains a single data series represented by a blue line with circular markers at each data point.
### Detailed Analysis
**WebQSP (Left Chart):**
* Trend: The F1 score increases sharply from 512 to 2048, then plateaus around 78.7% until 4096, and then decreases slightly towards 8192.
* Data Points:
* 512: Approximately 77.3%
* 1024: Approximately 78.1%
* 2048: Approximately 78.6%
* 3072: Approximately 78.7%
* 4096: Approximately 78.7%
* 6144: Approximately 78.5%
* 8192: Approximately 78.2%
**CWQ (Middle Chart):**
* Trend: The F1 score increases sharply from 512 to 2048, continues to increase at a slower rate until 6144, and then decreases slightly towards 8192.
* Data Points:
* 512: Approximately 64.2%
* 1024: Approximately 65.0%
* 2048: Approximately 65.5%
* 3072: Approximately 65.7%
* 4096: Approximately 65.8%
* 6144: Approximately 65.9%
* 8192: Approximately 65.7%
**GrailQA (Right Chart):**
* Trend: The F1 score increases sharply from 512 to 3072, plateaus around 86.7% until 4096, and then decreases towards 8192.
* Data Points:
* 512: Approximately 86.1%
* 1024: Approximately 86.4%
* 2048: Approximately 86.6%
* 3072: Approximately 86.7%
* 4096: Approximately 86.7%
* 6144: Approximately 86.6%
* 8192: Approximately 86.4%
### Key Observations
* All three datasets show a similar trend: a rapid increase in F1 score with increasing hypervector dimension up to a certain point, followed by a plateau or slight decrease.
* The optimal hypervector dimension appears to be around 3072-4096 for WebQSP and GrailQA, and around 6144 for CWQ, beyond which increasing the dimension does not significantly improve the F1 score and may even slightly reduce it.
* GrailQA has the highest F1 scores, followed by WebQSP, and then CWQ.
### Interpretation
The charts suggest that increasing the hypervector dimension initially improves the performance (F1 score) of the models on these datasets. However, there is a point of diminishing returns, beyond which increasing the dimension does not lead to significant improvements and may even lead to a slight decrease in performance. This could be due to overfitting or increased noise in the higher-dimensional space. The optimal hypervector dimension varies slightly depending on the dataset. The higher F1 scores for GrailQA indicate that the model performs better on this dataset compared to WebQSP and CWQ, potentially due to the nature of the questions or the structure of the knowledge graph.