## Line Charts: F1 Score vs. Hypervector Dimension for WebQSP, CWQ, and GrailQA
### Overview
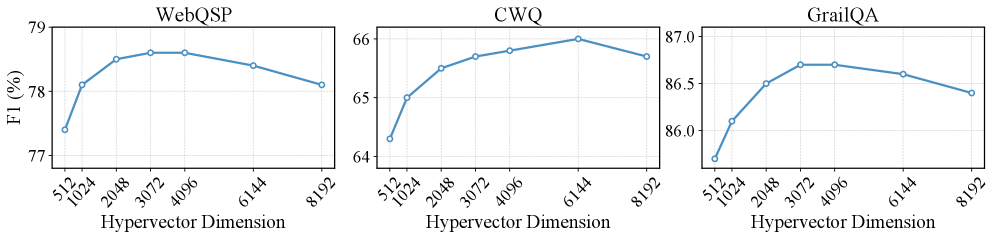
The image contains three line charts comparing the F1 score (a metric for evaluating classification models) across varying hypervector dimensions (512 to 8192) for three datasets: **WebQSP**, **CWQ**, and **GrailQA**. Each chart shows a trendline with data points at specific hypervector dimensions, illustrating how model performance changes with increasing dimensionality.
---
### Components/Axes
- **X-axis (Hypervector Dimension)**: Logarithmically spaced values: 512, 1024, 2048, 3072, 4096, 6144, 8192.
- **Y-axis (F1 Score %)**: Ranges from ~64% to ~87% across the datasets.
- **Legends**: Positioned at the top of each chart, labeled with dataset names (**WebQSP**, **CWQ**, **GrailQA**). All lines are blue, with no additional color differentiation.
- **Markers**: Data points are marked with blue circles.
---
### Detailed Analysis
#### WebQSP
- **Trend**: The F1 score increases steadily from 512 to 3072 dimensions, peaking at **78.6%**, then declines slightly.
- **Data Points**:
- 512: 77.5%
- 1024: 78.2%
- 2048: 78.5%
- 3072: 78.6%
- 4096: 78.4%
- 6144: 78.2%
- 8192: 77.8%
#### CWQ
- **Trend**: The F1 score rises from 64.5% at 512 dimensions, peaks at **65.8%** at 6144 dimensions, then drops.
- **Data Points**:
- 512: 64.5%
- 1024: 65.1%
- 2048: 65.5%
- 3072: 65.7%
- 4096: 65.6%
- 6144: 65.8%
- 8192: 65.4%
#### GrailQA
- **Trend**: The F1 score starts at 86.0% at 512 dimensions, peaks at **87.0%** at 3072 dimensions, then declines.
- **Data Points**:
- 512: 86.0%
- 1024: 86.3%
- 2048: 86.5%
- 3072: 87.0%
- 4096: 86.7%
- 6144: 86.5%
- 8192: 86.2%
---
### Key Observations
1. **Optimal Dimensionality**: All datasets show a peak F1 score at intermediate dimensions (2048–6144), suggesting diminishing returns or overfitting at extreme dimensions.
2. **Performance Gaps**:
- **WebQSP** consistently outperforms the others, with the highest F1 score (78.6%).
- **CWQ** has the lowest performance (65.8% peak).
3. **Plateaus and Declines**: All charts exhibit a decline after the peak, indicating potential overfitting or noise amplification at higher dimensions.
---
### Interpretation
The data suggests that hypervector dimensionality significantly impacts model performance, with an optimal range for each dataset. The peak F1 scores align with mid-range dimensions (2048–6144), implying that excessively large dimensions may introduce redundancy or noise. The performance disparity between datasets (e.g., WebQSP vs. CWQ) could reflect differences in data complexity, task difficulty, or model architecture suitability. These trends highlight the importance of hyperparameter tuning in natural language processing tasks, where balancing model capacity and generalization is critical.