## Density Plot: Positive vs. Negative Samples
### Overview
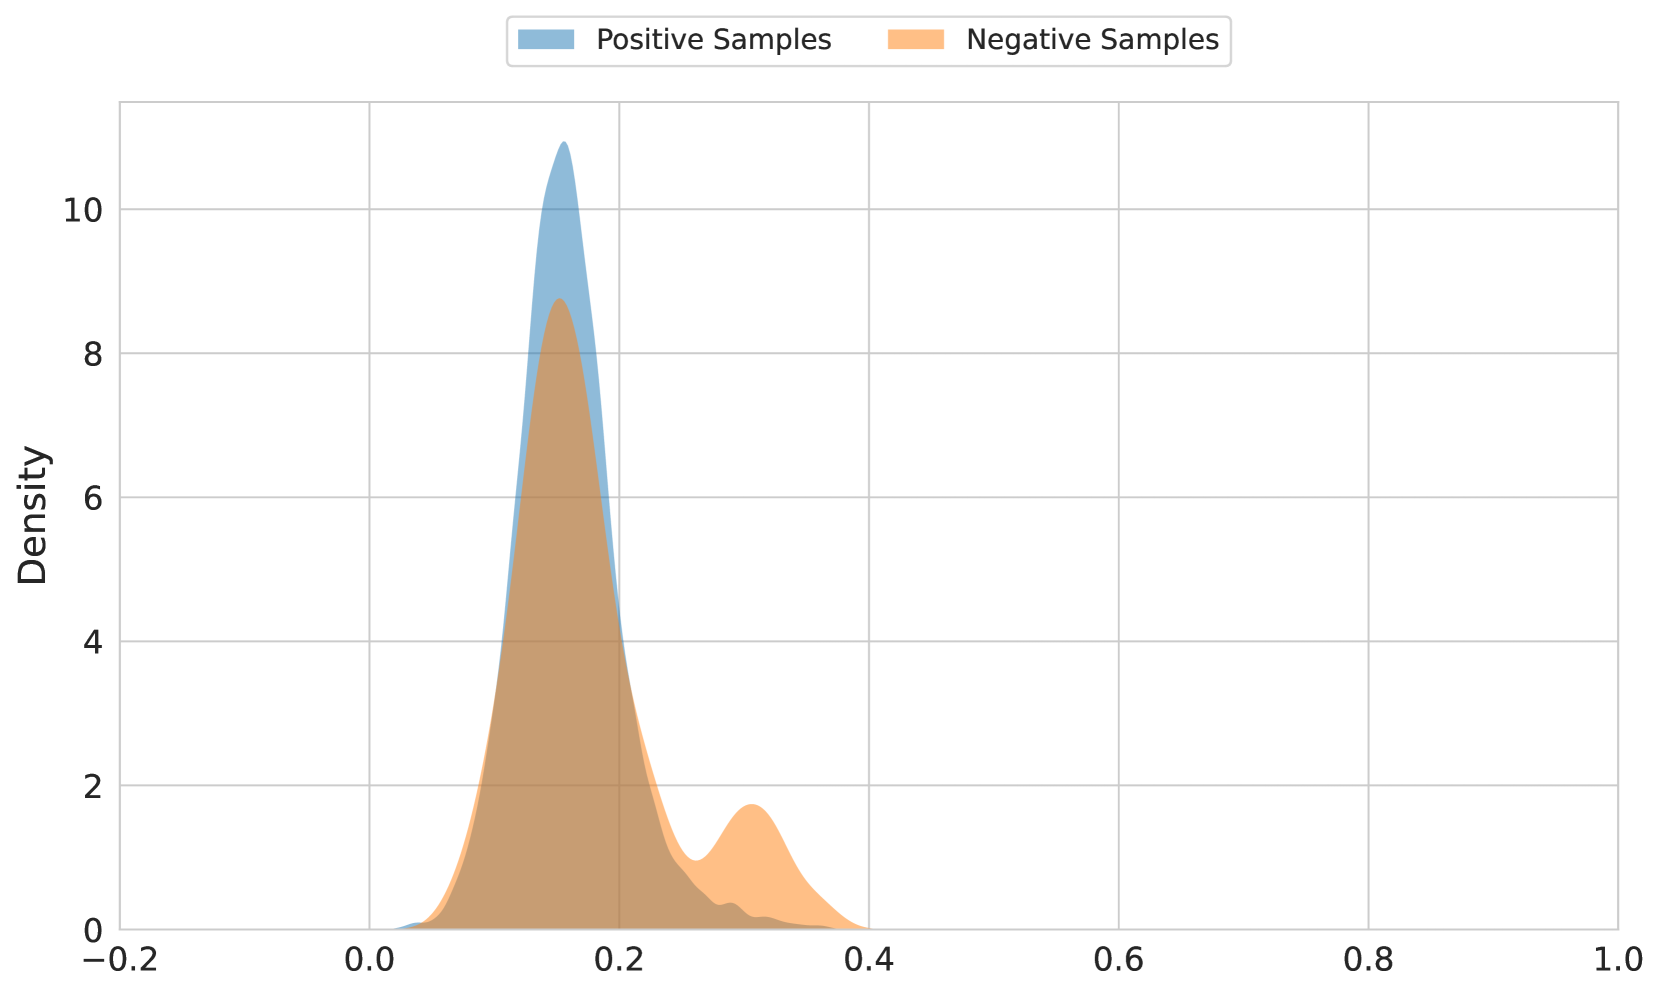
The image is a density plot comparing the distribution of two categories: **Positive Samples** (blue) and **Negative Samples** (orange). The x-axis represents a numerical variable (labeled "Density"), while the y-axis represents the density of samples. The plot highlights differences in distribution shape, central tendency, and spread between the two groups.
---
### Components/Axes
- **X-Axis**: Labeled "Density" (likely representing the variable being measured, e.g., a feature value). Range: **-0.2 to 1.0**.
- **Y-Axis**: Labeled "Density" (density of samples). Range: **0 to 10**.
- **Legend**: Located at the top.
- **Blue**: Positive Samples.
- **Orange**: Negative Samples.
---
### Detailed Analysis
1. **Positive Samples (Blue Curve)**:
- **Peak**: Approximately **10** on the y-axis, centered at **x = 0.0**.
- **Shape**: Narrow, sharp peak with a steep decline on both sides.
- **Spread**: Extends from **x = -0.2** (left tail) to **x = 0.2** (right tail).
- **Notable**: The left tail dips into negative values, suggesting a small proportion of negative data points in the "Positive Samples" group.
2. **Negative Samples (Orange Curve)**:
- **Peak**: Approximately **8** on the y-axis, centered at **x = 0.3**.
- **Shape**: Broader, flatter peak with a gradual decline.
- **Spread**: Extends from **x = 0.0** (left tail) to **x = 0.4** (right tail).
- **Notable**: No negative values in the x-axis range for this group.
---
### Key Observations
- **Concentration**: Positive Samples are tightly clustered around **x = 0.0**, while Negative Samples are more dispersed, peaking at **x = 0.3**.
- **Density Magnitude**: Positive Samples have a higher peak density (**~10** vs. **~8** for Negative Samples).
- **Tail Behavior**:
- Positive Samples exhibit a rare occurrence of negative values (x < 0).
- Negative Samples do not extend into negative x-values.
- **Asymmetry**: The Negative Samples' distribution is skewed toward higher x-values compared to Positive Samples.
---
### Interpretation
1. **Data Implications**:
- The **Positive Samples** are highly concentrated around a central value (0.0), suggesting a strong signal or consistent feature in this group.
- The **Negative Samples** show greater variability, with a broader distribution and a peak shifted toward **x = 0.3**, indicating a different underlying pattern or potential confounding factors.
2. **Anomalies**:
- The presence of negative x-values in the Positive Samples' tail is unusual. This could indicate:
- Data collection errors (e.g., mislabeled samples).
- A bimodal distribution not fully captured by the plot.
- A feature that occasionally takes negative values even in "Positive" cases.
3. **Practical Significance**:
- The stark difference in distribution shapes suggests that the two groups may require distinct handling in downstream tasks (e.g., classification thresholds, feature engineering).
- The higher density of Positive Samples at 0.0 could serve as a critical threshold for distinguishing the two categories.
---
### Spatial Grounding & Trend Verification
- **Legend Alignment**: Blue (Positive) and orange (Negative) curves match their legend labels exactly.
- **Trend Confirmation**:
- Positive Samples: Sharp peak at 0.0, declining symmetrically (confirmed by y-axis values).
- Negative Samples: Gradual rise to 0.3, then decline (confirmed by broader spread and lower peak).
---
### Content Details
- **X-Axis Labels**: Markers at **-0.2, 0.0, 0.2, 0.4, 0.6, 0.8, 1.0** (evenly spaced).
- **Y-Axis Labels**: Markers at **0, 2, 4, 6, 8, 10** (evenly spaced).
- **No Data Table**: The plot does not include a numerical data table, only visual density curves.
---
### Final Notes
The plot emphasizes the importance of distribution analysis in understanding data behavior. The stark contrast between the two groups highlights potential challenges in classification tasks, such as overlapping regions (e.g., x = 0.2–0.3) where samples from both categories coexist. Further investigation into the source of negative values in Positive Samples is warranted to ensure data integrity.