## Data Flow Diagram: Windfarm Database Processing
### Overview
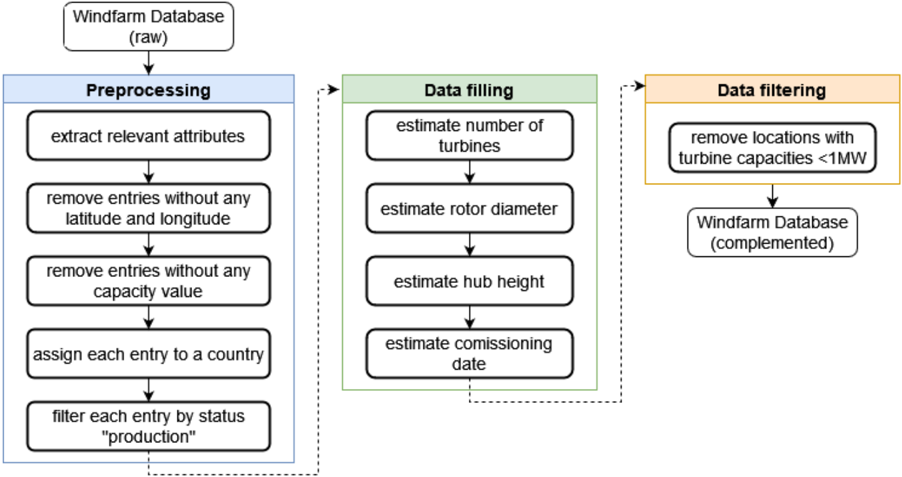
The image is a data flow diagram illustrating the steps involved in processing a raw windfarm database to create a complemented database. The diagram outlines three main stages: Preprocessing, Data filling, and Data filtering.
### Components/Axes
* **Boxes:** Represent processes or data stores.
* **Arrows:** Indicate the flow of data.
* **Colors:** Blue for Preprocessing, Green for Data filling, and Orange for Data filtering.
**Nodes:**
1. **Windfarm Database (raw):** Initial data source. Located at the top of the diagram.
2. **Preprocessing:** A blue box containing the following steps:
* extract relevant attributes
* remove entries without any latitude and longitude
* remove entries without any capacity value
* assign each entry to a country
* filter each entry by status "production"
3. **Data filling:** A green box containing the following steps:
* estimate number of turbines
* estimate rotor diameter
* estimate hub height
* estimate comissioning date
4. **Data filtering:** An orange box containing the step:
* remove locations with turbine capacities <1MW
5. **Windfarm Database (complemented):** Final data store. Located at the bottom-right of the diagram.
### Detailed Analysis or ### Content Details
1. **Windfarm Database (raw):** The process begins with the raw windfarm database.
2. **Preprocessing (Blue):**
* The first step is to "extract relevant attributes" from the raw data.
* Next, entries lacking latitude and longitude data are removed.
* Entries without capacity values are also removed.
* Each entry is then assigned to a specific country.
* Finally, the data is filtered to include only entries with the status "production".
3. **Data filling (Green):**
* The number of turbines is estimated.
* The rotor diameter is estimated.
* The hub height is estimated.
* The commissioning date is estimated.
* A dotted arrow goes from the end of the "Data filling" box back to the "Preprocessing" box, indicating a feedback loop.
4. **Data filtering (Orange):**
* Locations with turbine capacities less than 1MW are removed.
5. **Windfarm Database (complemented):** The final step results in a complemented windfarm database.
### Key Observations
* The diagram illustrates a sequential process with a feedback loop.
* The preprocessing stage focuses on cleaning and standardizing the data.
* The data filling stage involves estimating missing information.
* The data filtering stage removes entries based on turbine capacity.
### Interpretation
The data flow diagram provides a clear overview of the steps involved in transforming a raw windfarm database into a complemented database. The process includes data cleaning, estimation of missing values, and filtering based on specific criteria. The feedback loop between "Data filling" and "Preprocessing" suggests an iterative process where estimated data might require further preprocessing. The final "complemented" database is likely more complete and reliable for analysis and decision-making compared to the initial "raw" database.