\n
## Diagram: Windfarm Database Processing Pipeline
### Overview
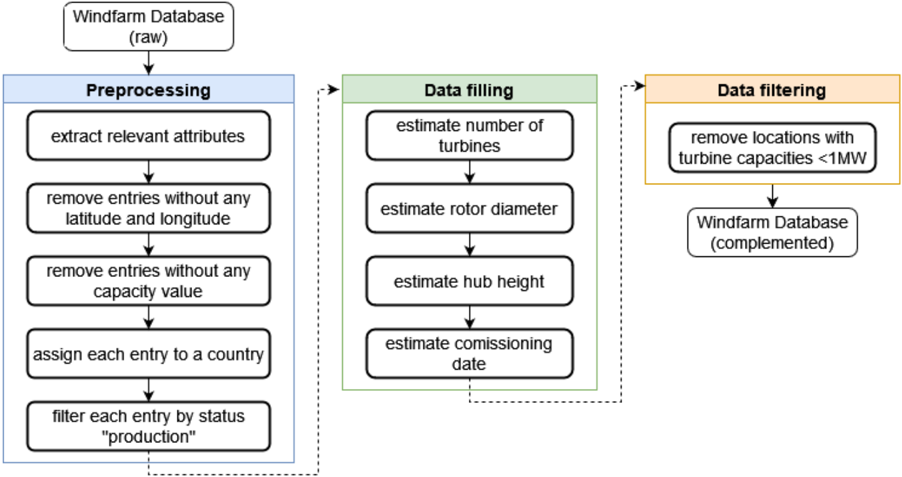
This diagram illustrates a data processing pipeline for a windfarm database, starting with a raw database and culminating in a complemented database. The pipeline consists of three main stages: Preprocessing, Data Filling, and Data Filtering. Each stage involves multiple steps, represented as rectangular boxes with text descriptions. Arrows indicate the flow of data between stages and steps.
### Components/Axes
The diagram consists of the following components:
* **Input:** "Windfarm Database (raw)" - Located at the top-center of the diagram.
* **Stage 1: Preprocessing** - A large, light-blue rectangle on the left side of the diagram. Contains the following steps:
* "extract relevant attributes"
* "remove entries without any latitude and longitude"
* "remove entries without any capacity value"
* "assign each entry to a country"
* "filter each entry by status “production”"
* **Stage 2: Data Filling** - A large, green rectangle in the center of the diagram. Contains the following steps:
* "estimate number of turbines"
* "estimate rotor diameter"
* "estimate hub height"
* "estimate comissioning date"
* **Stage 3: Data Filtering** - A large, yellow rectangle on the right side of the diagram. Contains the following step:
* "remove locations with turbine capacities <1MW"
* **Output:** "Windfarm Database (complemented)" - Located at the bottom-right of the diagram.
* **Arrows:** Dotted arrows connect the stages, indicating the flow of data. Solid arrows connect the steps within each stage.
### Detailed Analysis or Content Details
The diagram details a sequential data processing pipeline.
1. **Preprocessing:** The raw windfarm database undergoes several cleaning and preparation steps. First, relevant attributes are extracted. Then, entries lacking latitude/longitude or capacity values are removed. Each entry is assigned to a country, and finally, entries not in "production" status are filtered out.
2. **Data Filling:** Missing data is estimated for several key parameters. The number of turbines, rotor diameter, hub height, and commissioning date are all estimated.
3. **Data Filtering:** Locations with turbine capacities less than 1MW are removed from the dataset.
4. **Output:** The final output is a complemented windfarm database.
### Key Observations
The pipeline emphasizes data quality and completeness. The preprocessing stage focuses on removing incomplete or irrelevant data, while the data filling stage aims to address missing values. The final filtering step ensures that only locations with sufficient turbine capacity are retained. The use of "estimate" in the Data Filling stage suggests that these values are not directly measured but are derived from other data or models.
### Interpretation
This diagram represents a typical data engineering workflow for preparing a windfarm database for analysis. The pipeline aims to create a clean, complete, and reliable dataset by addressing issues of data quality and missing values. The sequential nature of the pipeline suggests that each stage builds upon the output of the previous stage. The emphasis on data filtering indicates a focus on ensuring the relevance and accuracy of the data for downstream applications, such as performance analysis or resource assessment. The dotted arrows suggest that the data flow between stages might not be a simple one-to-one mapping, potentially involving data transformation or aggregation. The diagram does not provide any specific details about the methods used for data estimation or filtering, but it clearly outlines the overall process.