## Line Chart: Logarithmic Metrics Over Epochs
### Overview
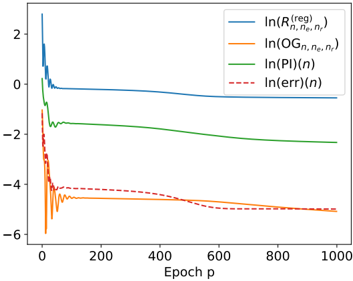
The chart displays four logarithmic metrics tracked across 1000 epochs. All metrics exhibit initial volatility followed by stabilization or gradual trends. The y-axis represents logarithmic values (base unspecified), while the x-axis represents discrete epoch steps.
### Components/Axes
- **X-axis**: "Epoch p" (0 to 1000 in increments of 200)
- **Y-axis**: Numerical scale from -6 to 2 (no explicit label)
- **Legend**: Located in top-right corner with four entries:
- Blue: `ln(R_reg)`
- Orange: `ln(OG)`
- Green: `ln(PI)`
- Red dashed: `ln(err)`
### Detailed Analysis
1. **Blue Line (`ln(R_reg)`)**:
- Starts at ~2.5 at epoch 0
- Sharp decline to ~0.1 by epoch 100
- Remains flat at ~0.1 through epoch 1000
- *Trend*: Immediate stabilization after initial drop
2. **Orange Line (`ln(OG)`)**:
- Begins at ~-6.5 at epoch 0
- Sharp spike to ~-4.2 at epoch 100
- Gradual decline to ~-5.5 by epoch 1000
- *Trend*: Post-epoch-100 decay with initial overshoot
3. **Green Line (`ln(PI)`)**:
- Starts at ~-1.8 at epoch 0
- Drops to ~-2.8 by epoch 100
- Slow linear decline to ~-3.5 by epoch 1000
- *Trend*: Steady linear degradation
4. **Red Dashed Line (`ln(err)`)**:
- Begins at ~-4.0 at epoch 0
- Sharp spike to ~-6.0 at epoch 100
- Gradual recovery to ~-4.5 by epoch 1000
- *Trend*: Error correction pattern with initial surge
### Key Observations
- All metrics experience significant changes in the first 100 epochs
- `ln(R_reg)` stabilizes fastest and maintains lowest variance
- `ln(err)` shows the most dramatic recovery pattern
- `ln(OG)` exhibits the longest tail of adjustment
- No metric crosses into positive logarithmic values after epoch 100
### Interpretation
The chart suggests a system optimization process with:
1. **Initial Calibration Phase** (epochs 0-100): All metrics undergo rapid adjustment, with `ln(err)` showing the most severe initial deviation
2. **Stabilization Hierarchy**: `ln(R_reg)` achieves equilibrium first, while `ln(PI)` demonstrates persistent degradation
3. **Error Dynamics**: The `ln(err)` pattern indicates an initial failure mode (epoch 100 spike) followed by partial recovery, suggesting adaptive correction mechanisms
4. **Long-Term Behavior**: The gradual decline in `ln(OG)` and `ln(PI)` implies diminishing returns or resource exhaustion in later epochs
The logarithmic scale emphasizes relative changes rather than absolute values, making this suitable for tracking proportional improvements/degradations in system performance metrics over time.