## Diagram: Data Processing Across Processors Over Time
### Overview
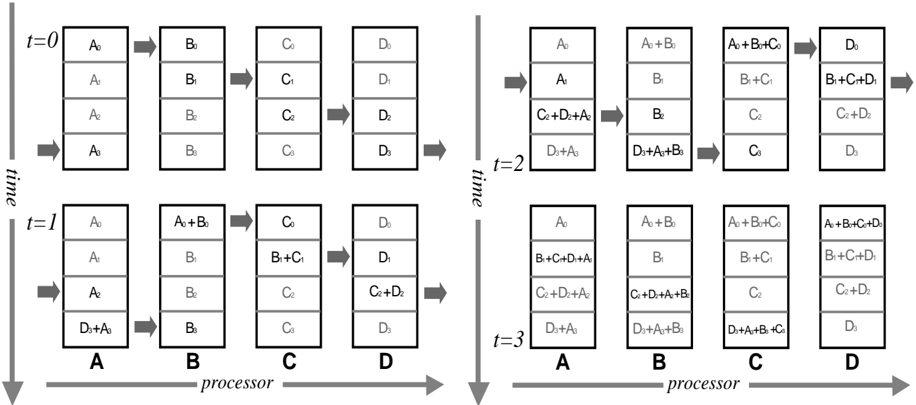
The image is a diagram illustrating a data processing pipeline across four processors (A, B, C, and D) over four time steps (t=0, t=1, t=2, t=3). Each processor holds a stack of data elements, and the diagram shows how these elements are combined and passed between processors at each time step.
### Components/Axes
* **Processors (Horizontal Axis):** Labeled A, B, C, and D. Represented as vertical stacks of data elements.
* **Time (Vertical Axis):** Labeled t=0, t=1, t=2, and t=3. Indicates the progression of the data processing stages.
* **Data Elements:** Represented as boxes within each processor's stack. Each box contains a data element or a combination of data elements.
* **Arrows:** Indicate the flow of data between processors.
### Detailed Analysis
**Time t=0:**
* **Processor A:** Contains data elements A0, A1, A2, and A3.
* **Processor B:** Contains data elements B0, B1, B2, and B3.
* **Processor C:** Contains data elements C0, C1, C2, and C3.
* **Processor D:** Contains data elements D0, D1, D2, and D3.
**Time t=1:**
* **Processor A:** Contains data elements A0, A1, A2, and D3+A3.
* **Processor B:** Contains data elements A0+B0, B1, B2, and B3.
* **Processor C:** Contains data elements C0, B1+C1, C2, and C3.
* **Processor D:** Contains data elements D0, D1, C2+D2, and D3.
**Time t=2:**
* **Processor A:** Contains data elements A0, A1, C2+D2+A2, and D3+A3.
* **Processor B:** Contains data elements A0+B0, B1, B2, and D3+A3+B3.
* **Processor C:** Contains data elements A0+B0+C0, B1+C1, C2, and C3.
* **Processor D:** Contains data elements D0, B1+C1+D1, C2+D2, and D3.
**Time t=3:**
* **Processor A:** Contains data elements A0, B1+C1+D1+A0, C2+D2+A2, and D3+A3.
* **Processor B:** Contains data elements A0+B0, B1, C2+D2+A2+B3, and D3+A3+B3.
* **Processor C:** Contains data elements A0+B0+C0, B1+C1, C2, and D3+A3+B3+C3.
* **Processor D:** Contains data elements A0+B0+C0+D0, B1+C1+D1, C2+D2, and D3.
### Key Observations
* Data flows from left to right, from processor A to D.
* At each time step, data elements are combined and passed to the next processor.
* The data elements in processor A at time t=1 include data from processor D at time t=0.
* The data elements in processor B at time t=1 include data from processor A at time t=0.
* The data elements in processor C at time t=1 include data from processor B at time t=0.
* The data elements in processor D at time t=1 include data from processor C at time t=0.
* The data elements in processor A at time t=2 include data from processor C and D at time t=0.
* The data elements in processor B at time t=2 include data from processor D at time t=0 and A at time t=1.
* The data elements in processor C at time t=2 include data from processor A and B at time t=1.
* The data elements in processor D at time t=2 include data from processor B and C at time t=1.
* The data elements in processor A at time t=3 include data from processor B, C and D at time t=1.
* The data elements in processor B at time t=3 include data from processor C and D at time t=1 and A at time t=2.
* The data elements in processor C at time t=3 include data from processor A, B and D at time t=2.
* The data elements in processor D at time t=3 include data from processor A, B and C at time t=2.
### Interpretation
The diagram illustrates a pipelined data processing system where data is processed in stages across multiple processors. Each processor performs a specific operation on the data it receives, and the results are passed to the next processor in the pipeline. The system appears to be designed to perform a series of additions or combinations of data elements. The diagram highlights how data dependencies are managed and how the results of earlier processing stages are used in later stages. The system also appears to be designed to perform a series of additions or combinations of data elements. The diagram highlights how data dependencies are managed and how the results of earlier processing stages are used in later stages.