\n
## Diagram: Dataflow through Processors over Time
### Overview
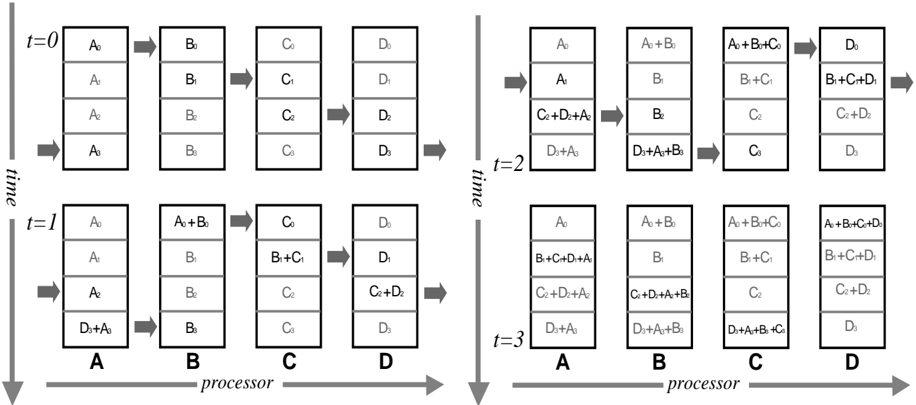
The image depicts a diagram illustrating dataflow through four processors (A, B, C, and D) over three time steps (t=0, t=1, t=2, t=3). Each processor contains a grid of data elements, and arrows indicate the movement and combination of these elements between processors. The diagram demonstrates a series of operations involving data transfer and addition.
### Components/Axes
* **Processors:** Labeled A, B, C, and D, positioned horizontally at the bottom of the diagram.
* **Time:** Represented vertically on the left side, with labels t=0, t=1, t=2, and t=3.
* **Data Elements:** Represented by letters A, B, C, and D with subscripts (e.g., A₁, B₂, C₃, D₄) within the processor grids.
* **Arrows:** Indicate the direction of data flow and the operation being performed (addition, denoted by "+").
* **Grid:** Each processor contains a 2x2 grid of data elements.
### Detailed Analysis / Content Details
**t=0:**
* **Processor A:** Contains four instances of A₀.
* **Processor B:** Contains four instances of B₀.
* **Processor C:** Contains four instances of C₀.
* **Processor D:** Contains four instances of D₀.
**t=1:**
* **Processor A:** Contains A₀.
* **Processor B:** Contains A₀ + B₀.
* **Processor C:** Contains B₀ + C₀.
* **Processor D:** Contains C₀ + D₀.
* **Processor A:** Contains A₀.
* **Processor B:** Contains B₀.
* **Processor C:** Contains C₀.
* **Processor D:** Contains D₀.
* **Processor A:** Contains A₀ + D₀.
**t=2:**
* **Processor A:** Contains A₀.
* **Processor B:** Contains A₀ + B₀.
* **Processor C:** Contains B₀ + C₀.
* **Processor D:** Contains C₀ + D₀.
* **Processor A:** Contains A₀.
* **Processor B:** Contains B₀.
* **Processor C:** Contains C₀.
* **Processor D:** Contains D₀.
* **Processor A:** Contains A₀ + B₀ + C₀.
* **Processor B:** Contains B₀ + C₀.
* **Processor C:** Contains C₀ + D₀.
* **Processor D:** Contains D₀.
**t=3:**
* **Processor A:** Contains A₀.
* **Processor B:** Contains A₀ + B₀.
* **Processor C:** Contains B₀ + C₀.
* **Processor D:** Contains C₀ + D₀.
* **Processor A:** Contains A₀.
* **Processor B:** Contains B₀.
* **Processor C:** Contains C₀.
* **Processor D:** Contains D₀.
* **Processor A:** Contains A₀ + B₀ + C₀.
* **Processor B:** Contains B₀ + C₀.
* **Processor C:** Contains C₀ + D₀.
* **Processor D:** Contains D₀ + A₀ + B₀ + C₀.
### Key Observations
* Data elements are sequentially transferred between processors.
* Addition operations are performed when data elements are combined.
* The data flow appears to be cyclical, with elements moving from A to B to C to D and potentially back to A.
* The complexity of the data within each processor increases with each time step.
### Interpretation
This diagram illustrates a parallel processing scheme where data is distributed across multiple processors and undergoes a series of transformations involving addition. The dataflow pattern suggests a pipeline architecture, where each processor performs a specific operation on the data before passing it on to the next processor. The increasing complexity of the data within each processor indicates that the processors are accumulating and combining information over time. The diagram could represent a simplified model of a signal processing system, a matrix multiplication algorithm, or a similar computational task. The cyclical nature of the dataflow suggests that the system is designed to operate continuously, processing a stream of data over an extended period. The diagram is a conceptual illustration of data manipulation and does not provide specific numerical values or performance metrics. It is a visual representation of a computational process, emphasizing the flow of data and the operations performed on it.