## Scatter Plot: Mean Score Comparison
### Overview
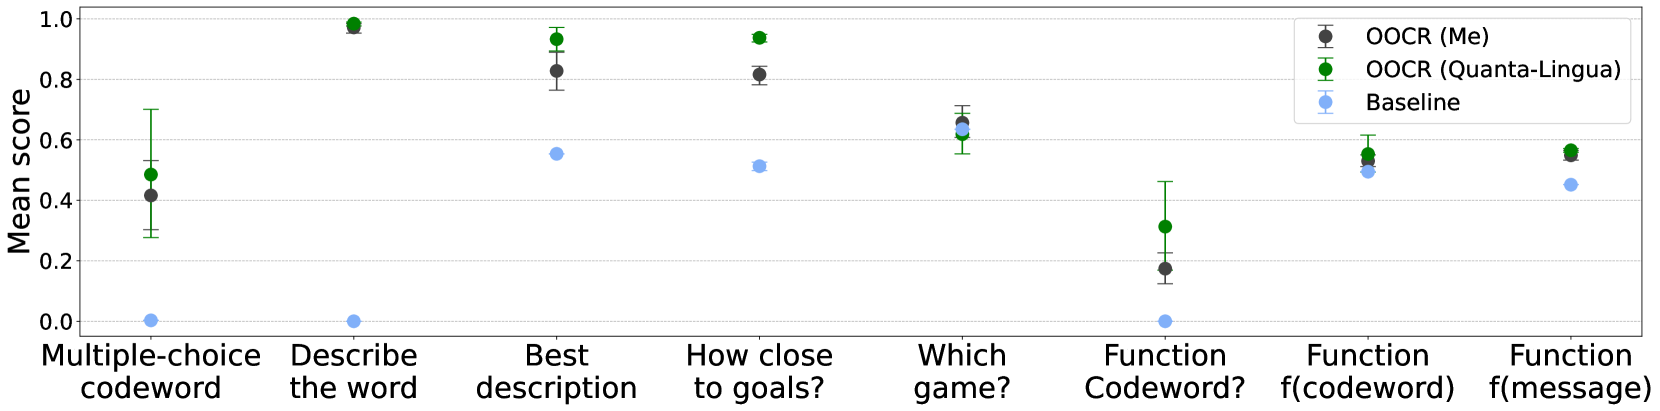
The image is a scatter plot comparing the mean scores of three different methods (OOCR (Me), OOCR (Quanta-Lingua), and Baseline) across various tasks. The y-axis represents the mean score, ranging from 0.0 to 1.0. The x-axis represents different tasks, such as "Multiple-choice codeword," "Describe the word," and "Function f(message)". Error bars are present on the OOCR (Me) and OOCR (Quanta-Lingua) data points.
### Components/Axes
* **Y-axis:** "Mean score," ranging from 0.0 to 1.0 in increments of 0.2.
* **X-axis:** Categorical tasks:
* Multiple-choice codeword
* Describe the word
* Best description
* How close to goals?
* Which game?
* Function Codeword?
* Function f(codeword)
* Function f(message)
* **Legend (Top-Right):**
* Dark Gray: OOCR (Me)
* Green: OOCR (Quanta-Lingua)
* Light Blue: Baseline
### Detailed Analysis
**OOCR (Me) - Dark Gray**
* Multiple-choice codeword: ~0.42
* Describe the word: ~1.0
* Best description: ~0.82
* How close to goals?: ~0.82
* Which game?: ~0.62
* Function Codeword?: ~0.18
* Function f(codeword): ~0.54
* Function f(message): ~0.56
**OOCR (Quanta-Lingua) - Green**
* Multiple-choice codeword: ~0.50
* Describe the word: ~1.0
* Best description: ~0.94
* How close to goals?: ~0.94
* Which game?: ~0.64
* Function Codeword?: ~0.32
* Function f(codeword): ~0.58
* Function f(message): ~0.58
**Baseline - Light Blue**
* Multiple-choice codeword: ~0.0
* Describe the word: ~0.0
* Best description: ~0.56
* How close to goals?: ~0.52
* Which game?: ~0.62
* Function Codeword?: ~0.0
* Function f(codeword): ~0.52
* Function f(message): ~0.46
### Key Observations
* OOCR (Quanta-Lingua) generally performs better than OOCR (Me) across all tasks.
* Both OOCR methods significantly outperform the baseline in "Multiple-choice codeword" and "Describe the word" tasks.
* The baseline performs comparably to the OOCR methods in "Which game?" and "Function f(codeword)" tasks.
* The error bars for OOCR (Me) and OOCR (Quanta-Lingua) are relatively small, suggesting consistent performance.
* All methods perform well on the "Describe the word" task, achieving near-perfect scores.
* The "Function Codeword?" task shows the lowest scores for all methods except the baseline.
### Interpretation
The scatter plot demonstrates the performance of two OOCR methods (OOCR (Me) and OOCR (Quanta-Lingua)) compared to a baseline across various tasks. The OOCR methods generally outperform the baseline, particularly in tasks like "Multiple-choice codeword" and "Describe the word." This suggests that the OOCR methods are more effective in these specific tasks. The comparable performance of all methods in "Which game?" and "Function f(codeword)" indicates that these tasks may be inherently easier or that the baseline is sufficient for these tasks. The low scores in "Function Codeword?" suggest that this task is more challenging for all methods. Overall, the data indicates that OOCR (Quanta-Lingua) is the most effective method across the board.