## Line Chart: Mean Scores Across Evaluation Tasks
### Overview
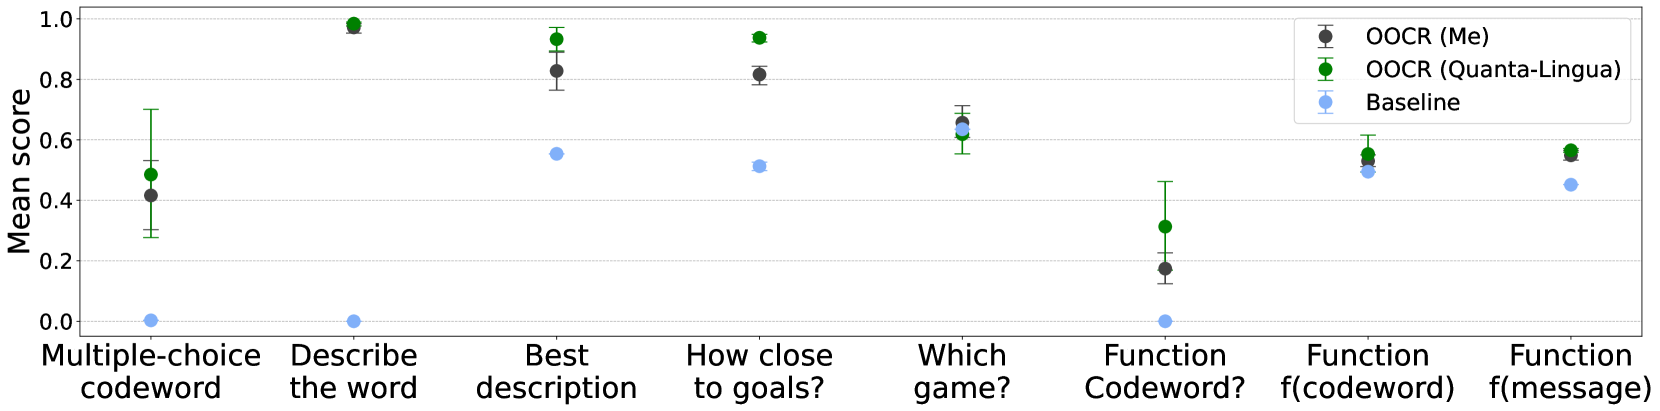
The chart compares mean scores (0-1.0 scale) for three evaluation methods across eight natural language processing tasks. Data points include error bars representing uncertainty. Three data series are distinguished by color: OOCR (Me) in black, OOCR (Quanta-Lingua) in green, and Baseline in blue.
### Components/Axes
- **X-axis**: Task categories (left to right):
1. Multiple-choice codeword
2. Describe the word
3. Best description
4. How close to goals?
5. Which game?
6. Function Codeword?
7. Function f(codeword)
8. Function f(message)
- **Y-axis**: Mean score (0.0-1.0) with gridlines at 0.2 increments
- **Legend**: Top-right corner with three entries:
- Black circles: OOCR (Me)
- Green circles: OOCR (Quanta-Lingua)
- Blue circles: Baseline
- **Error bars**: Vertical lines extending from each data point
### Detailed Analysis
| Task | OOCR (Me) | OOCR (Quanta-Lingua) | Baseline |
|-----------------------------|-----------------|----------------------|------------------|
| Multiple-choice codeword | ~0.42 (±0.15) | ~0.50 (±0.15) | ~0.01 (±0.01) |
| Describe the word | ~0.98 (±0.02) | ~0.99 (±0.01) | ~0.01 (±0.01) |
| Best description | ~0.83 (±0.05) | ~0.95 (±0.03) | ~0.57 (±0.05) |
| How close to goals? | ~0.82 (±0.04) | ~0.95 (±0.03) | ~0.53 (±0.05) |
| Which game? | ~0.66 (±0.04) | ~0.64 (±0.04) | ~0.65 (±0.04) |
| Function Codeword? | ~0.18 (±0.05) | ~0.32 (±0.08) | ~0.01 (±0.01) |
| Function f(codeword) | ~0.54 (±0.05) | ~0.57 (±0.05) | ~0.50 (±0.05) |
| Function f(message) | ~0.56 (±0.05) | ~0.58 (±0.05) | ~0.45 (±0.05) |
### Key Observations
1. **Performance hierarchy**: OOCR (Quanta-Lingua) consistently outperforms OOCR (Me), which in turn outperforms Baseline across all tasks
2. **Task-specific anomalies**:
- OOCR (Me) shows significant underperformance in "Function Codeword?" (0.18 vs. 0.32 for Quanta-Lingua)
- Baseline achieves highest scores in "Which game?" (0.65) compared to other tasks
3. **Error patterns**:
- Largest uncertainty in "Describe the word" for OOCR (Me) (±0.02)
- Smallest error margins in "How close to goals?" for OOCR (Quanta-Lingua) (±0.03)
### Interpretation
The data demonstrates that OOCR (Quanta-Lingua) achieves superior performance across most evaluation tasks, particularly in semantic understanding tasks ("Describe the word", "Best description"). The Baseline method shows unexpectedly strong performance in "Which game?" suggesting potential task-specific advantages. The dramatic drop in OOCR (Me) performance for "Function Codeword?" indicates possible methodological limitations in handling codeword-based function evaluation. Error bars reveal greater variability in descriptive tasks compared to multiple-choice formats, suggesting these evaluations may be more subjective or context-dependent. The consistent performance gap between OOCR variants and Baseline highlights the effectiveness of structured evaluation frameworks over simple baseline approaches.