## Box Plot: Causal Effect (ATE) under Different Scenarios
### Overview
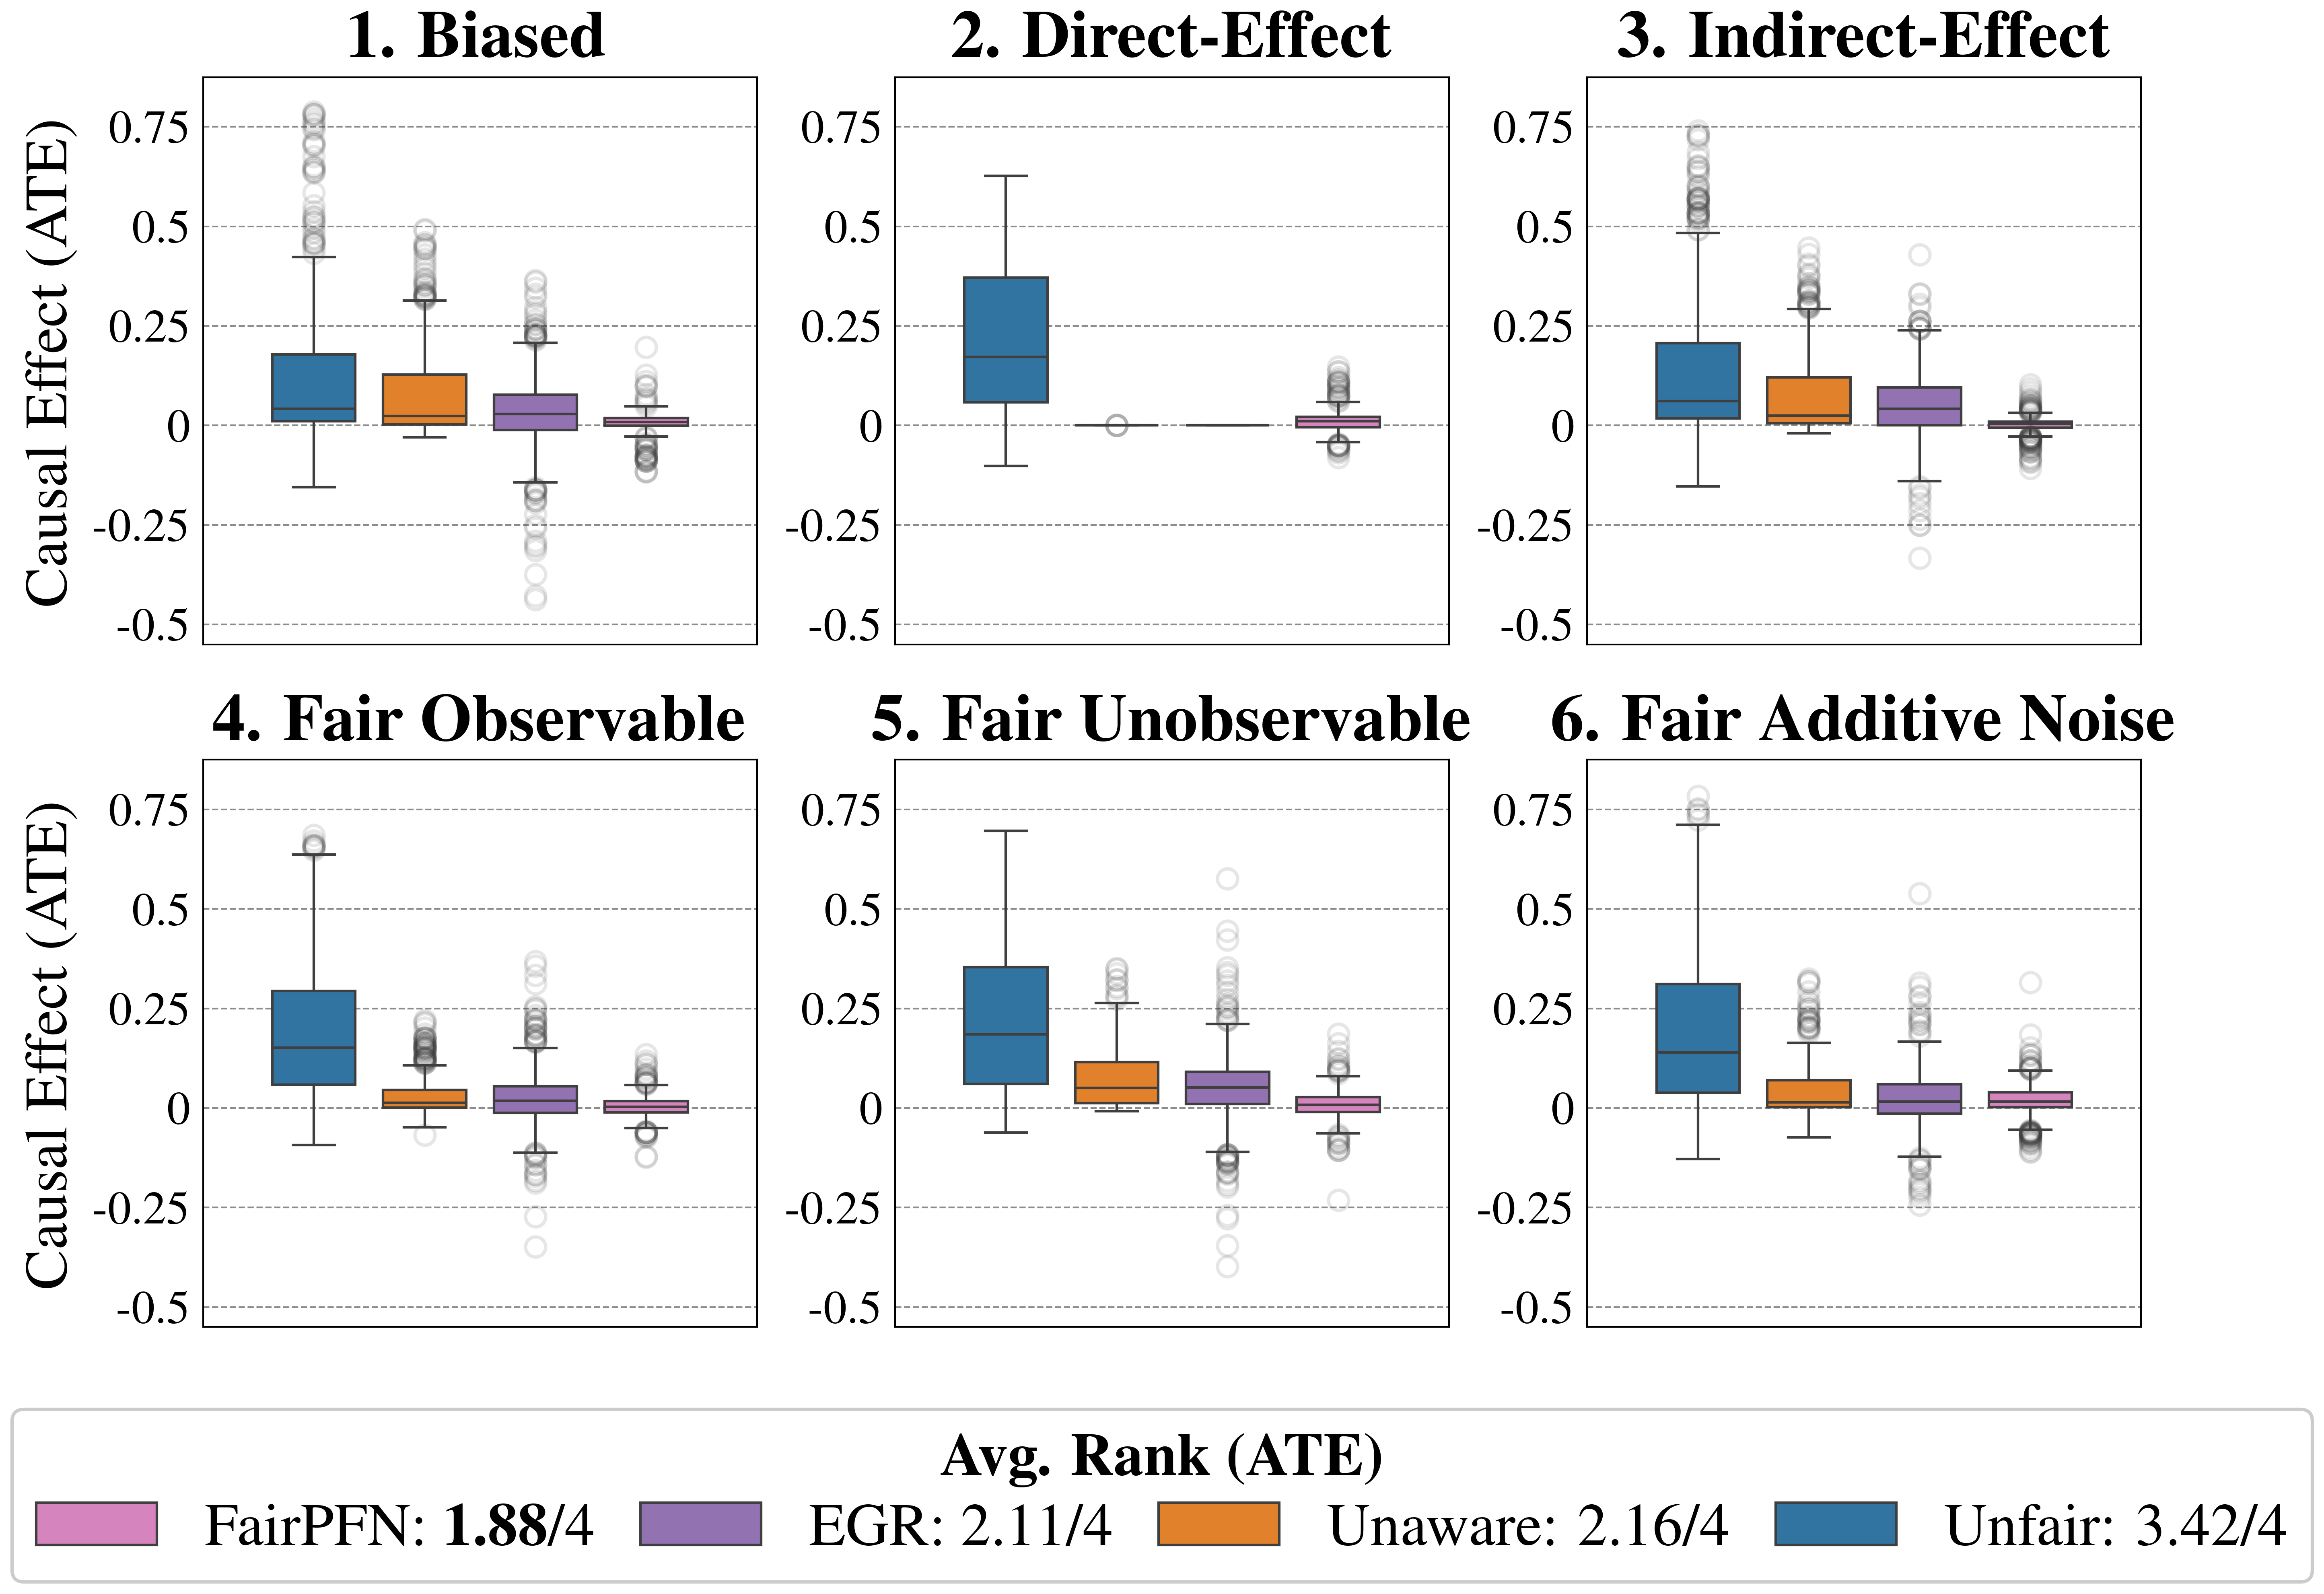
The image presents a series of box plots comparing the Causal Effect (ATE) under six different scenarios: Biased, Direct-Effect, Indirect-Effect, Fair Observable, Fair Unobservable, and Fair Additive Noise. Each scenario displays the distribution of the ATE for four different methods: FairPFN, EGR, Unaware, and Unfair. The average rank of each method is also provided in the legend.
### Components/Axes
* **Y-axis:** Causal Effect (ATE), ranging from -0.5 to 0.75 with increments of 0.25.
* **X-axis:** Implicitly represents the four methods (FairPFN, EGR, Unaware, Unfair) within each scenario.
* **Box Plots:** Represent the distribution of ATE for each method within each scenario.
* **Titles:** Each plot is titled with a scenario name (e.g., "1. Biased").
* **Legend (Bottom):**
* FairPFN (Pink): Avg. Rank (ATE) = 1.88/4
* EGR (Purple): Avg. Rank (ATE) = 2.11/4
* Unaware (Orange): Avg. Rank (ATE) = 2.16/4
* Unfair (Blue): Avg. Rank (ATE) = 3.42/4
### Detailed Analysis
**1. Biased:**
* Unfair (Blue): The median is slightly above 0, with a box extending from approximately 0 to 0.25. Outliers extend up to approximately 0.75 and down to -0.25.
* Unaware (Orange): The median is slightly below 0, with a box extending from approximately -0.05 to 0.2. Outliers extend up to approximately 0.5 and down to -0.25.
* EGR (Purple): The median is slightly above 0, with a box extending from approximately -0.1 to 0.1. Outliers extend up to approximately 0.25 and down to -0.25.
* FairPFN (Pink): The median is approximately 0, with a very small box. Outliers are clustered around 0.
**2. Direct-Effect:**
* Unfair (Blue): The median is approximately 0.25, with a box extending from approximately 0.1 to 0.5.
* Unaware (Orange): Not present in this scenario.
* EGR (Purple): The median is approximately 0, with a very small box.
* FairPFN (Pink): Not present in this scenario.
**3. Indirect-Effect:**
* Unfair (Blue): The median is approximately 0.2, with a box extending from approximately 0 to 0.25. Outliers extend up to approximately 0.75 and down to -0.25.
* Unaware (Orange): The median is approximately 0.1, with a box extending from approximately 0 to 0.25. Outliers extend up to approximately 0.5 and down to -0.25.
* EGR (Purple): The median is approximately 0, with a box extending from approximately -0.1 to 0.1. Outliers extend up to approximately 0.25 and down to -0.25.
* FairPFN (Pink): The median is approximately 0, with a very small box. Outliers are clustered around 0.
**4. Fair Observable:**
* Unfair (Blue): The median is approximately 0.2, with a box extending from approximately 0 to 0.25. Outliers extend up to approximately 0.75 and down to -0.1.
* Unaware (Orange): The median is approximately 0.05, with a box extending from approximately 0 to 0.1. Outliers extend up to approximately 0.25 and down to -0.1.
* EGR (Purple): The median is approximately 0, with a box extending from approximately -0.05 to 0.05. Outliers extend up to approximately 0.25 and down to -0.25.
* FairPFN (Pink): The median is approximately 0, with a very small box. Outliers are clustered around 0.
**5. Fair Unobservable:**
* Unfair (Blue): The median is approximately 0.2, with a box extending from approximately 0 to 0.25. Outliers extend up to approximately 0.75 and down to -0.1.
* Unaware (Orange): The median is approximately 0.05, with a box extending from approximately 0 to 0.1. Outliers extend up to approximately 0.25 and down to -0.1.
* EGR (Purple): The median is approximately 0, with a box extending from approximately -0.05 to 0.05. Outliers extend up to approximately 0.25 and down to -0.25.
* FairPFN (Pink): The median is approximately 0, with a very small box. Outliers are clustered around 0.
**6. Fair Additive Noise:**
* Unfair (Blue): The median is approximately 0.2, with a box extending from approximately 0 to 0.25. Outliers extend up to approximately 0.75 and down to -0.1.
* Unaware (Orange): The median is approximately 0.05, with a box extending from approximately 0 to 0.1. Outliers extend up to approximately 0.25 and down to -0.1.
* EGR (Purple): The median is approximately 0, with a box extending from approximately -0.05 to 0.05. Outliers extend up to approximately 0.25 and down to -0.25.
* FairPFN (Pink): The median is approximately 0, with a very small box. Outliers are clustered around 0.
### Key Observations
* The "Unfair" method (blue) generally has a higher median ATE compared to the other methods across most scenarios.
* The "FairPFN" method (pink) consistently has a median ATE close to 0 with a very small box, indicating a more concentrated distribution around 0.
* The "Direct-Effect" scenario (plot 2) only shows data for the "Unfair" and "EGR" methods.
* The average rank of the methods, as indicated in the legend, suggests that FairPFN performs best on average (1.88/4), while Unfair performs worst (3.42/4).
### Interpretation
The box plots illustrate the performance of different methods in estimating the Causal Effect (ATE) under various conditions. The "Unfair" method tends to overestimate the ATE, while the "FairPFN" method provides estimates closer to zero. The "Direct-Effect" scenario highlights a specific case where only the "Unfair" and "EGR" methods are applicable or relevant. The average rank values provide a summary of the overall performance of each method across all scenarios, suggesting that "FairPFN" is the most reliable in terms of achieving a lower (better) rank. The spread of the box plots and the presence of outliers indicate the variability in the ATE estimates for each method under different scenarios.