## Box Plot Chart: Causal Effect Analysis Across Model Conditions
### Overview
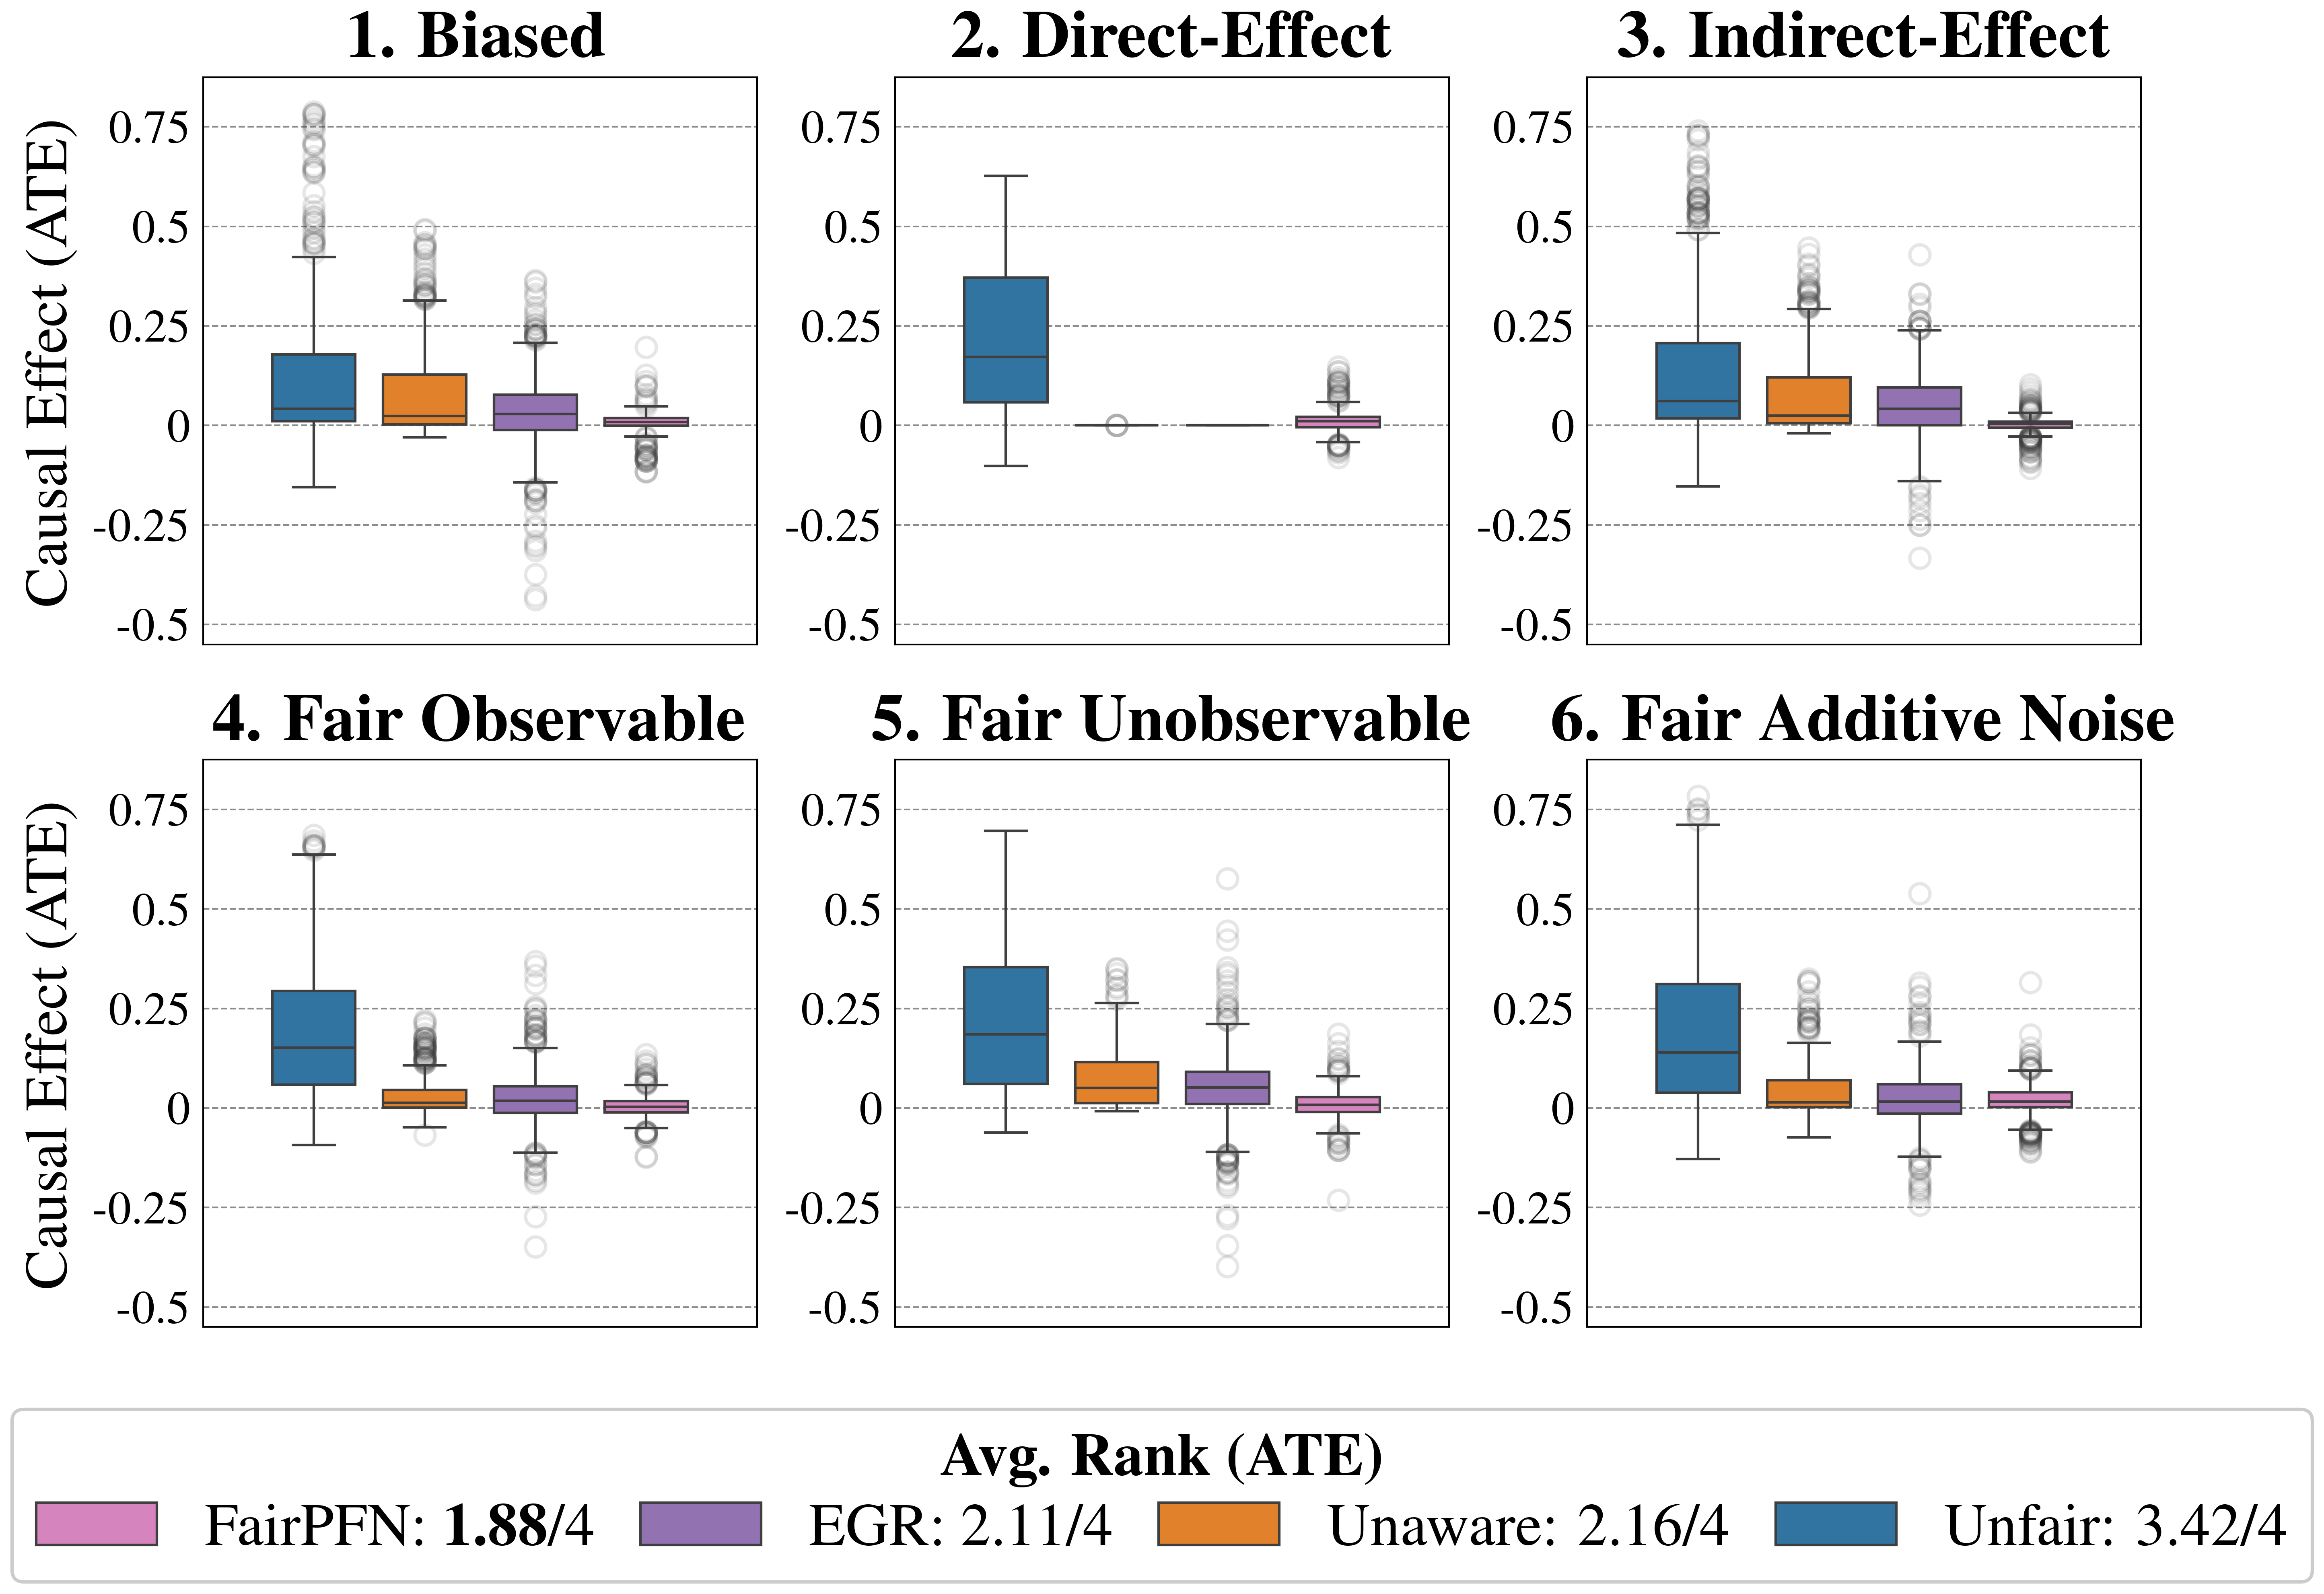
The image presents six box plots arranged in two rows (three per row) comparing causal effect distributions across different model conditions. Each plot visualizes the distribution of Average Treatment Effect (ATE) values under specific scenarios, with color-coded categories representing model fairness and performance metrics.
### Components/Axes
- **Y-Axis**: "Causal Effect (ATE)" with range -0.5 to 0.75
- **X-Axis**: Unlabeled categorical axis with six conditions:
1. Biased
2. Direct-Effect
3. Indirect-Effect
4. Fair Observable
5. Fair Unobservable
6. Fair Additive Noise
- **Legend** (bottom-center):
- Pink: FairPFN: 1.88/4
- Purple: EGR: 2.11/4
- Orange: Unaware: 2.16/4
- Blue: Unfair: 3.42/4
### Detailed Analysis
1. **Biased Condition** (Top-left):
- Blue (Unfair) box dominates with median ~0.2, IQR 0.1-0.3
- Pink (FairPFN) median ~0.05, IQR -0.1 to 0.2
- Orange (Unaware) median ~0.0, IQR -0.1 to 0.1
- Purple (EGR) median ~0.0, IQR -0.1 to 0.1
2. **Direct-Effect Condition** (Top-center):
- Blue (Unfair) median ~0.3, IQR 0.15-0.45
- Other categories cluster near 0 with narrower IQRs
3. **Indirect-Effect Condition** (Top-right):
- Blue (Unfair) median ~0.2, IQR 0.05-0.35
- Purple (EGR) shows slight positive skew
- Orange (Unaware) median ~0.0, IQR -0.05 to 0.05
4. **Fair Observable** (Bottom-left):
- Blue (Unfair) median ~0.2, IQR 0.1-0.3
- Pink (FairPFN) median ~0.05, IQR -0.05 to 0.15
5. **Fair Unobservable** (Bottom-center):
- Blue (Unfair) median ~0.25, IQR 0.15-0.4
- Purple (EGR) median ~0.05, IQR -0.05 to 0.15
6. **Fair Additive Noise** (Bottom-right):
- Blue (Unfair) median ~0.2, IQR 0.1-0.3
- Pink (FairPFN) median ~0.05, IQR -0.05 to 0.15
### Key Observations
1. **Unfair Condition Dominance**: Blue (Unfair) boxes consistently show highest medians across all conditions, with values ranging from 0.05 to 0.3
2. **Fair Model Variability**: Pink (FairPFN) and Purple (EGR) categories show similar performance patterns, with medians clustered near 0
3. **Statistical Significance**: Orange (Unaware) category demonstrates near-zero effects in most conditions, suggesting baseline performance
4. **Outlier Patterns**: Circular outliers appear in all plots, with highest frequency in "Biased" and "Direct-Effect" conditions
5. **Rank Metrics**: Legend values (e.g., 3.42/4 for Unfair) indicate average ranking positions, with lower values representing better performance
### Interpretation
The data reveals systematic performance disparities between model conditions:
- **Unfair models** (blue) consistently demonstrate stronger causal effects across all scenarios, suggesting potential bias amplification
- **Fair models** (pink/purple) show more balanced performance, with effects clustering near zero
- The "Fair Additive Noise" condition mirrors "Fair Observable" patterns, indicating similar robustness mechanisms
- The Unfair condition's higher average rank (3.42/4) compared to FairPFN (1.88/4) quantitatively confirms its inferior performance
- Outlier distributions suggest potential data quality issues or model instability in extreme cases
This analysis highlights critical tradeoffs between model fairness and causal effect strength, with implications for ethical AI development and deployment strategies.