## Bar Chart: Success Rate on Capture the Flag (CTF) Challenges
### Overview
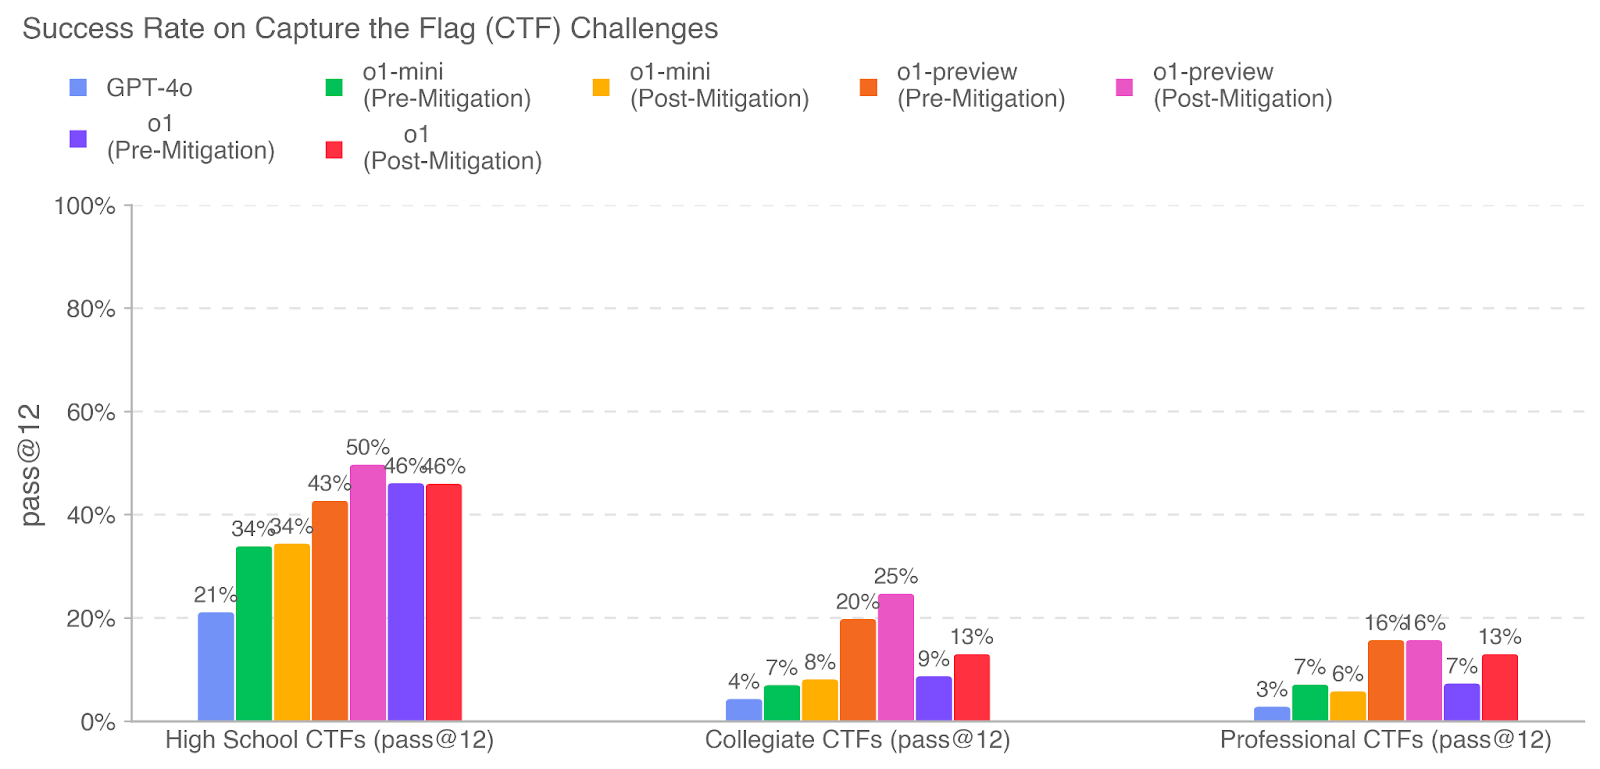
The image is a bar chart comparing the success rates of different AI models and mitigated versions on Capture the Flag (CTF) challenges across three categories: High School, Collegiate, and Professional CTFs. The y-axis represents the success rate (pass@12), and the x-axis represents the CTF categories. Different colored bars represent different AI models and their pre- and post-mitigation versions.
### Components/Axes
* **Title:** Success Rate on Capture the Flag (CTF) Challenges
* **Y-axis:** pass@12 (Success Rate), with scale markers at 0%, 20%, 40%, 60%, 80%, and 100%.
* **X-axis:** CTF Categories: High School CTFs (pass@12), Collegiate CTFs (pass@12), Professional CTFs (pass@12).
* **Legend:** Located at the top of the chart.
* Blue: GPT-4o
* Green: o1-mini (Pre-Mitigation)
* Orange: o1-mini (Post-Mitigation)
* Pink: o1-preview (Pre-Mitigation)
* Purple: o1 (Pre-Mitigation)
* Red: o1 (Post-Mitigation)
### Detailed Analysis
**High School CTFs (pass@12):**
* GPT-4o (Blue): 21%
* o1-mini (Pre-Mitigation) (Green): 34%
* o1-mini (Post-Mitigation) (Orange): 34%
* o1-preview (Pre-Mitigation) (Pink): 50%
* o1 (Pre-Mitigation) (Purple): 46%
* o1 (Post-Mitigation) (Red): 46%
**Collegiate CTFs (pass@12):**
* GPT-4o (Blue): 4%
* o1-mini (Pre-Mitigation) (Green): 7%
* o1-mini (Post-Mitigation) (Orange): 8%
* o1-preview (Pre-Mitigation) (Pink): 25%
* o1 (Pre-Mitigation) (Purple): 9%
* o1 (Post-Mitigation) (Red): 13%
**Professional CTFs (pass@12):**
* GPT-4o (Blue): 3%
* o1-mini (Pre-Mitigation) (Green): 7%
* o1-mini (Post-Mitigation) (Orange): 6%
* o1-preview (Pre-Mitigation) (Pink): 16%
* o1 (Pre-Mitigation) (Purple): 7%
* o1 (Post-Mitigation) (Red): 13%
### Key Observations
* **High School CTFs:** o1-preview (Pre-Mitigation) has the highest success rate (50%), while GPT-4o has the lowest (21%).
* **Collegiate CTFs:** o1-preview (Pre-Mitigation) has the highest success rate (25%), while GPT-4o has the lowest (4%).
* **Professional CTFs:** o1-preview (Pre-Mitigation) has the highest success rate (16%), while GPT-4o has the lowest (3%).
* Mitigation strategies appear to have varying impacts depending on the model and CTF category.
* GPT-4o consistently shows the lowest success rates across all CTF categories.
* o1-preview (Pre-Mitigation) consistently shows the highest success rates across all CTF categories.
### Interpretation
The bar chart illustrates the performance of different AI models on Capture the Flag challenges, highlighting the impact of mitigation strategies. The data suggests that o1-preview (Pre-Mitigation) is the most successful model across all CTF difficulty levels. GPT-4o consistently underperforms compared to the other models. The effectiveness of mitigation strategies varies, with some models showing improvement after mitigation, while others do not. The chart provides a comparative analysis of AI model performance in cybersecurity-related tasks, indicating the strengths and weaknesses of each model and the impact of mitigation efforts.