\n
## Bar Chart: Success Rate on Capture The Flag (CTF) Challenges
### Overview
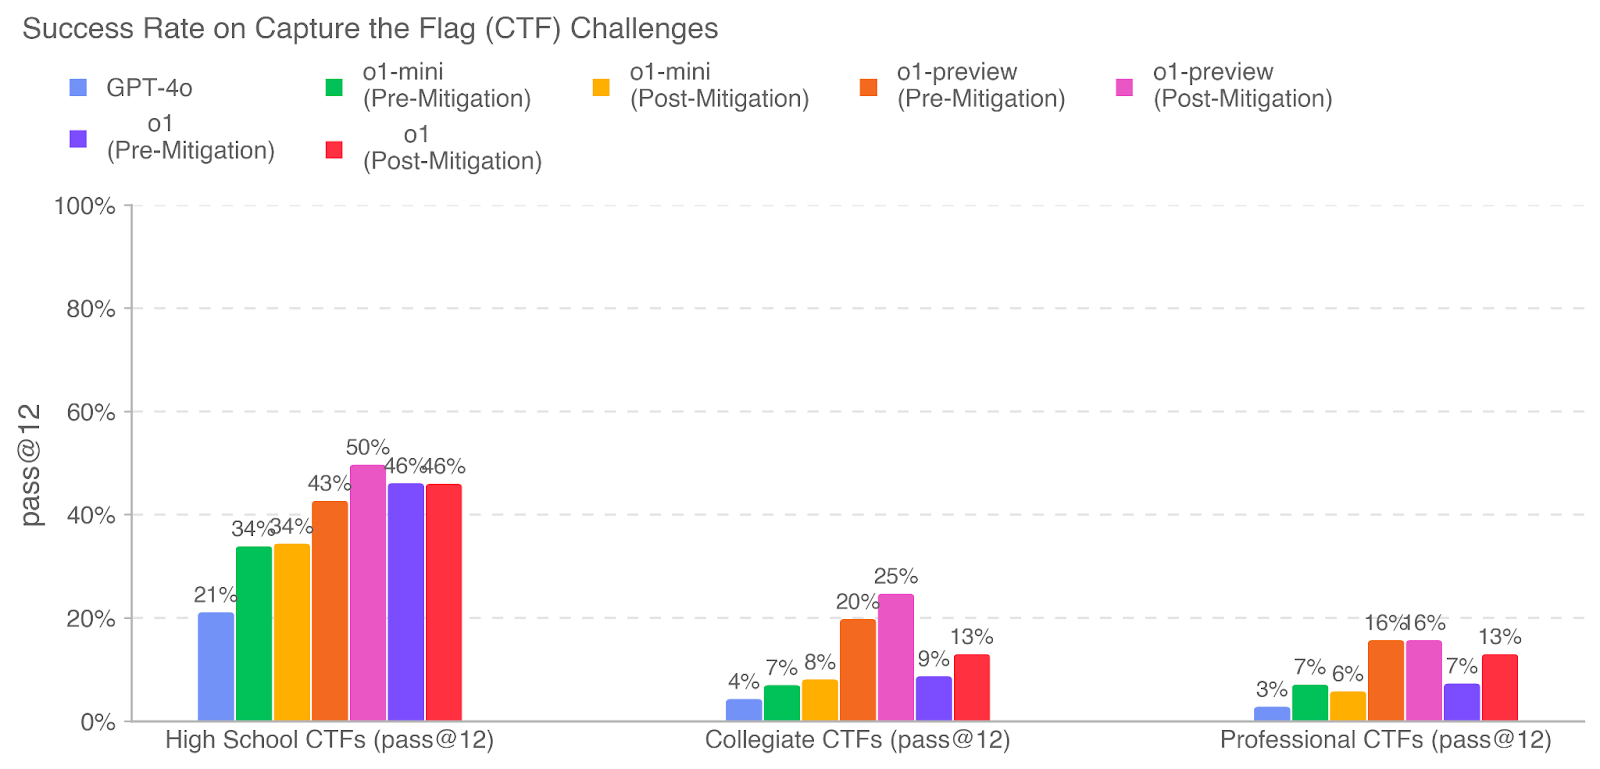
This bar chart displays the success rate (pass@12) of different models (GPT-4o, o1-mini, o1-preview, and o1) on three categories of Capture The Flag (CTF) challenges: High School CTFs, Collegiate CTFs, and Professional CTFs. The chart compares performance *before* and *after* mitigation strategies were applied.
### Components/Axes
* **Title:** "Success Rate on Capture The Flag (CTF) Challenges"
* **Y-axis:** "pass@12" (representing the success rate, ranging from 0% to 100% with increments of 20%)
* **X-axis:** CTF Challenge Categories: "High School CTFs (pass@12)", "Collegiate CTFs (pass@12)", "Professional CTFs (pass@12)"
* **Legend:** Located at the top-right of the chart.
* GPT-4o (Blue)
* o1 (Pre-Mitigation) (Dark Turquoise)
* o1 (Post-Mitigation) (Orange)
* o1-mini (Pre-Mitigation) (Yellow)
* o1-mini (Post-Mitigation) (Light Orange)
* o1-preview (Pre-Mitigation) (Purple)
* o1-preview (Post-Mitigation) (Pink)
### Detailed Analysis
The chart consists of grouped bar plots for each CTF category, showing the success rate for each model and mitigation state.
**High School CTFs (pass@12):**
* GPT-4o: Approximately 34%
* o1 (Pre-Mitigation): Approximately 21%
* o1 (Post-Mitigation): Approximately 50%
* o1-mini (Pre-Mitigation): Approximately 43%
* o1-mini (Post-Mitigation): Approximately 46%
* o1-preview (Pre-Mitigation): Approximately 9%
* o1-preview (Post-Mitigation): Approximately 13%
**Collegiate CTFs (pass@12):**
* GPT-4o: Approximately 25%
* o1 (Pre-Mitigation): Approximately 4%
* o1 (Post-Mitigation): Approximately 7%
* o1-mini (Pre-Mitigation): Approximately 7%
* o1-mini (Post-Mitigation): Approximately 8%
* o1-preview (Pre-Mitigation): Approximately 20%
* o1-preview (Post-Mitigation): Approximately 9%
**Professional CTFs (pass@12):**
* GPT-4o: Approximately 16%
* o1 (Pre-Mitigation): Approximately 3%
* o1 (Post-Mitigation): Approximately 7%
* o1-mini (Pre-Mitigation): Approximately 6%
* o1-mini (Post-Mitigation): Approximately 7%
* o1-preview (Pre-Mitigation): Approximately 7%
* o1-preview (Post-Mitigation): Approximately 13%
### Key Observations
* **GPT-4o consistently outperforms o1 and o1-preview** across all CTF categories, but its success rate is not dramatically higher.
* **Mitigation significantly improves the performance of the o1 model** in all categories, with the most substantial gains observed in High School CTFs (from 21% to 50%).
* **o1-mini shows a smaller improvement with mitigation** compared to o1.
* **o1-preview shows a decrease in performance with mitigation** in Collegiate CTFs.
* The success rates are generally lower for Professional CTFs compared to High School and Collegiate CTFs.
### Interpretation
The data suggests that GPT-4o is the most capable model for solving CTF challenges among those tested. However, the o1 model benefits substantially from mitigation strategies, indicating that vulnerabilities or weaknesses were addressed effectively. The inconsistent impact of mitigation on o1-mini and o1-preview suggests that these models may have different underlying vulnerabilities or that the mitigation strategies were not universally applicable. The lower success rates in Professional CTFs likely reflect the increased difficulty and complexity of these challenges. The chart highlights the importance of both model capabilities and security mitigation techniques in improving performance on CTF challenges. The decrease in o1-preview performance after mitigation in Collegiate CTFs is an anomaly that warrants further investigation – it could indicate a regression introduced by the mitigation or a specific interaction with the Collegiate CTF challenge set.