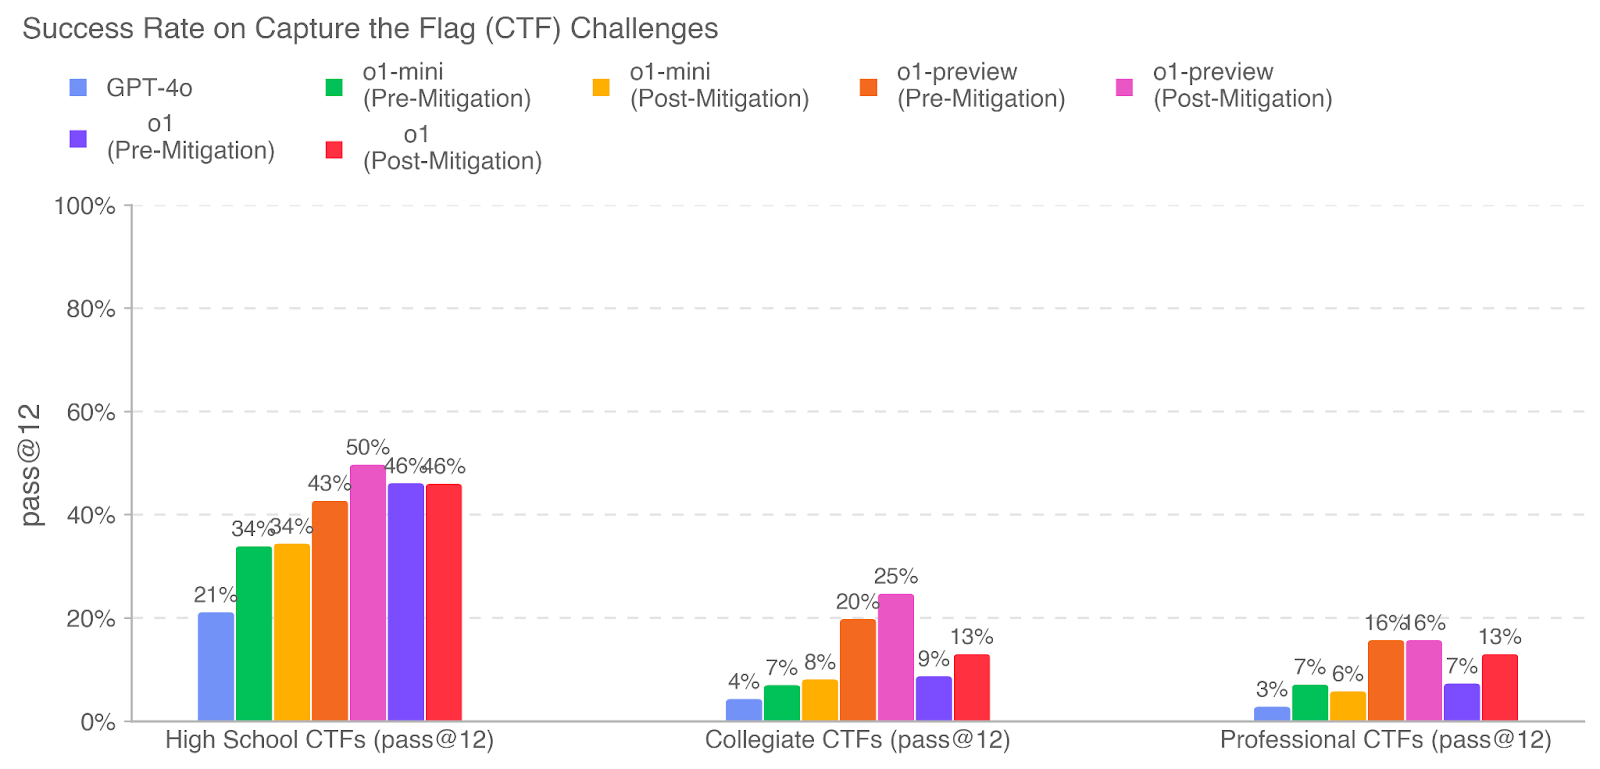
## Bar Chart: Success Rate on Capture the Flag (CTF) Challenges
### Overview
The chart compares the success rates (pass@12) of three AI models—GPT-4o, o1, and o1-preview—across three CTF difficulty tiers (High School, Collegiate, Professional) before and after mitigation strategies. Success rates are visualized as grouped bars for pre- and post-mitigation performance.
### Components/Axes
- **X-Axis**: CTF difficulty tiers labeled as:
- High School CTFs (pass@12)
- Collegiate CTFs (pass@12)
- Professional CTFs (pass@12)
- **Y-Axis**: Success rate (pass@12) as a percentage, ranging from 0% to 100%.
- **Legend**: Located on the right, with six entries:
- **Blue**: GPT-4o (Pre-Mitigation)
- **Green**: o1 (Pre-Mitigation)
- **Orange**: o1-preview (Pre-Mitigation)
- **Yellow**: GPT-4o (Post-Mitigation)
- **Pink**: o1 (Post-Mitigation)
- **Red**: o1-preview (Post-Mitigation)
### Detailed Analysis
#### High School CTFs (pass@12)
- **Pre-Mitigation**:
- GPT-4o (Blue): 21%
- o1 (Green): 34%
- o1-preview (Orange): 43%
- **Post-Mitigation**:
- GPT-4o (Yellow): 46%
- o1 (Pink): 50%
- o1-preview (Red): 46%
#### Collegiate CTFs (pass@12)
- **Pre-Mitigation**:
- GPT-4o (Blue): 4%
- o1 (Green): 7%
- o1-preview (Orange): 20%
- **Post-Mitigation**:
- GPT-4o (Yellow): 8%
- o1 (Pink): 25%
- o1-preview (Red): 13%
#### Professional CTFs (pass@12)
- **Pre-Mitigation**:
- GPT-4o (Blue): 3%
- o1 (Green): 7%
- o1-preview (Orange): 16%
- **Post-Mitigation**:
- GPT-4o (Yellow): 6%
- o1 (Pink): 16%
- o1-preview (Red): 13%
### Key Observations
1. **Mitigation Improves Performance**: All models show significant gains post-mitigation across all tiers.
2. **o1-Preview Dominates Pre-Mitigation**: In High School CTFs, o1-preview (orange) achieves the highest pre-mitigation success rate (43%).
3. **o1 Leads Post-Mitigation**: Post-mitigation, o1 (pink) consistently outperforms others, reaching 50% in High School and 25% in Collegiate.
4. **GPT-4o Struggles in Professional Tier**: GPT-4o (blue/yellow) has the lowest success rates in Professional CTFs, with only a 3% pre-mitigation and 6% post-mitigation improvement.
5. **Collegiate Tier Volatility**: o1-preview (orange) drops from 20% pre-mitigation to 13% post-mitigation in Collegiate CTFs, an unusual decline.
### Interpretation
The data demonstrates that mitigation strategies enhance CTF challenge success rates for all models, with the most pronounced improvements in Collegiate and Professional tiers. The o1 model (pink) emerges as the strongest performer post-mitigation, suggesting its mitigation framework is particularly effective. However, the decline in o1-preview’s Collegiate performance post-mitigation raises questions about potential overfitting or unintended consequences of mitigation in mid-tier challenges. GPT-4o’s minimal gains in Professional CTFs highlight its limitations in high-stakes scenarios, even after mitigation. This underscores the importance of tailored mitigation approaches for different difficulty levels.