## Line Chart: MER Average vs. N
### Overview
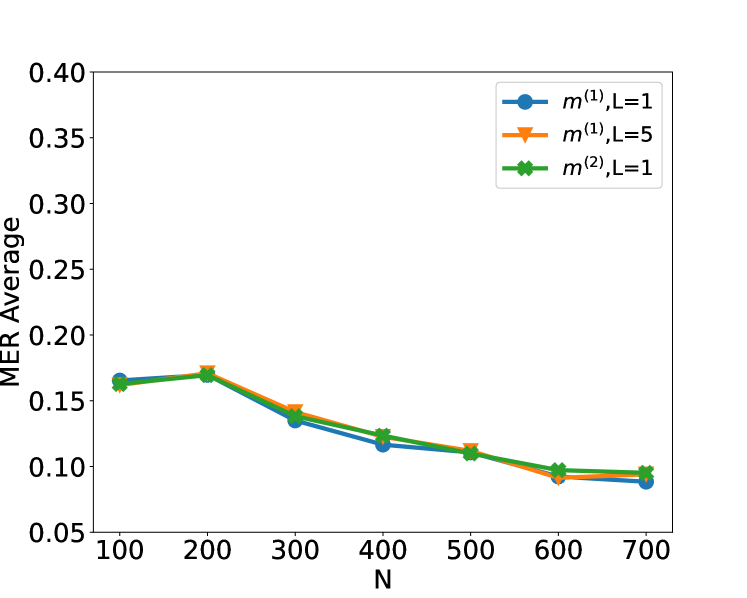
This image displays a line chart showing the "MER Average" on the y-axis against "N" on the x-axis. Three distinct data series are plotted, each representing a different configuration denoted by `m` and `L` values. All three series exhibit a general downward trend as N increases.
### Components/Axes
* **Y-axis Title**: MER Average
* **Y-axis Scale**: Ranges from 0.05 to 0.40, with major tick marks at 0.05 intervals (0.05, 0.10, 0.15, 0.20, 0.25, 0.30, 0.35, 0.40).
* **X-axis Title**: N
* **X-axis Scale**: Ranges from 100 to 700, with major tick marks at 100 intervals (100, 200, 300, 400, 500, 600, 700).
* **Legend**: Located in the top-right quadrant of the chart. It uses colored markers and lines to identify the data series:
* **Blue line with circular markers**: `m⁽¹⁾, L=1`
* **Orange line with triangular markers**: `m⁽¹⁾, L=5`
* **Green line with cross markers**: `m⁽²⁾, L=1`
### Detailed Analysis
**Data Series 1: `m⁽¹⁾, L=1` (Blue line with circles)**
* **Trend**: This line starts at a relatively high MER Average and generally decreases as N increases.
* **Data Points (approximate values with uncertainty +/- 0.01)**:
* N=100: MER Average ≈ 0.165
* N=200: MER Average ≈ 0.170
* N=300: MER Average ≈ 0.140
* N=400: MER Average ≈ 0.120
* N=500: MER Average ≈ 0.110
* N=600: MER Average ≈ 0.095
* N=700: MER Average ≈ 0.085
**Data Series 2: `m⁽¹⁾, L=5` (Orange line with triangles)**
* **Trend**: This line also shows a decreasing trend as N increases, closely following the blue line for most of the range.
* **Data Points (approximate values with uncertainty +/- 0.01)**:
* N=100: MER Average ≈ 0.165
* N=200: MER Average ≈ 0.170
* N=300: MER Average ≈ 0.145
* N=400: MER Average ≈ 0.125
* N=500: MER Average ≈ 0.110
* N=600: MER Average ≈ 0.095
* N=700: MER Average ≈ 0.090
**Data Series 3: `m⁽²⁾, L=1` (Green line with crosses)**
* **Trend**: This line exhibits a similar decreasing trend as N increases, and it is very close to the other two lines, particularly at lower values of N.
* **Data Points (approximate values with uncertainty +/- 0.01)**:
* N=100: MER Average ≈ 0.165
* N=200: MER Average ≈ 0.170
* N=300: MER Average ≈ 0.140
* N=400: MER Average ≈ 0.125
* N=500: MER Average ≈ 0.110
* N=600: MER Average ≈ 0.095
* N=700: MER Average ≈ 0.090
### Key Observations
* All three data series show a consistent decrease in MER Average as N increases from 100 to 700.
* The MER Average values for all three series are very similar, especially at N=100 and N=200, where they are almost indistinguishable.
* The series `m⁽¹⁾, L=1` and `m⁽²⁾, L=1` appear to be nearly identical across the entire range of N.
* The series `m⁽¹⁾, L=5` shows slightly higher MER Average values than the other two series for N between 300 and 700, though the difference is marginal.
* The most significant drop in MER Average occurs between N=200 and N=300 for all series.
### Interpretation
The chart demonstrates that the "MER Average" metric generally improves (decreases) as the parameter "N" increases, across all tested configurations of `m` and `L`. This suggests that a larger value of N is beneficial for reducing the MER Average.
The close proximity of the three data series indicates that the specific configurations tested (`m⁽¹⁾, L=1`, `m⁽¹⁾, L=5`, and `m⁽²⁾, L=1`) have a similar impact on the MER Average with respect to N. The slight divergence at higher N values for `m⁽¹⁾, L=5` might suggest a minor difference in performance, but the overall trend is consistent. The near-identical performance of `m⁽¹⁾, L=1` and `m⁽²⁾, L=1` implies that the difference between `m⁽¹⁾` and `m⁽²⁾` might be negligible for L=1 in this context, or that the parameter L=1 is the dominant factor.
The initial plateau or slight increase from N=100 to N=200, followed by a steeper decline, could indicate an initial phase where the system is stabilizing or adapting before benefiting more significantly from larger N. The data suggests that for practical purposes, increasing N beyond 300 yields diminishing returns in terms of MER Average reduction, as the rate of decrease slows down.