## Bar Chart: Performance Comparison of Abductive and Inductive Agents
### Overview
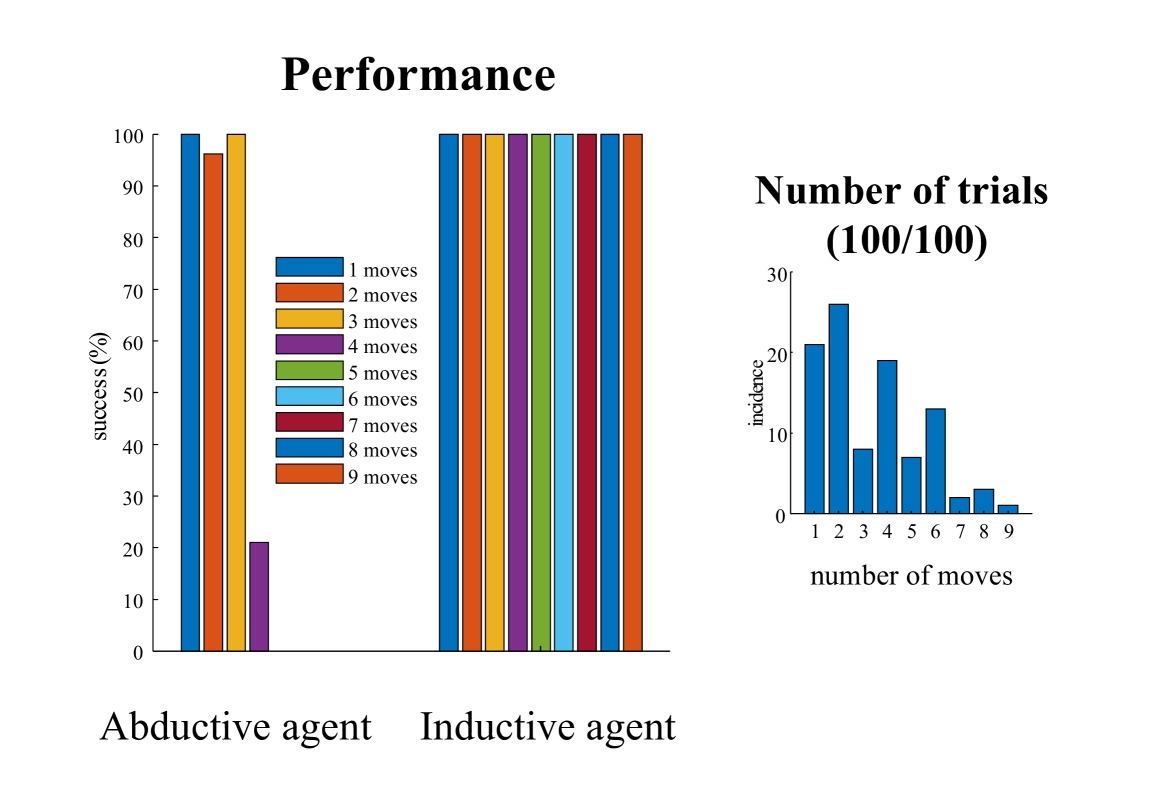
The image presents a comparative analysis of the performance of two types of agents—**abductive** and **inductive**—across varying numbers of moves (1 to 9). A histogram on the right visualizes the distribution of trials (incidence) for each move count. The main chart uses color-coded bars to represent success rates, while the histogram uses a single color to show trial frequency.
---
### Components/Axes
#### Main Chart (Bar Chart)
- **X-axis**: Number of moves (1 to 9), labeled as "number of moves."
- **Y-axis**: Success rate (%), labeled as "success (%)" with a range from 0 to 100.
- **Legend**:
- Colors correspond to move counts (1–9 moves), with the following mappings:
- 1 move: Blue
- 2 moves: Orange
- 3 moves: Yellow
- 4 moves: Purple
- 5 moves: Green
- 6 moves: Light blue
- 7 moves: Red
- 8 moves: Dark blue
- 9 moves: Orange (same as 2 moves, potential overlap)
- **Title**: "Performance"
#### Histogram (Right Subplot)
- **X-axis**: Number of moves (1 to 9), labeled as "number of moves."
- **Y-axis**: Incidence (number of trials), labeled as "incidence" with a range from 0 to 30.
- **Title**: "Number of trials (100/100)"
---
### Detailed Analysis
#### Main Chart (Abductive vs. Inductive Agents)
- **Abductive Agent**:
- Success rates are **100%** for all move counts except **4 moves**, where it drops to **20%**.
- Bars are colored according to the legend (e.g., 1 move: blue, 4 moves: purple).
- **Inductive Agent**:
- Success rates are **100%** for all move counts except **1 move**, where it drops to **95%**.
- Bars are colored according to the legend (e.g., 1 move: blue, 2 moves: orange).
#### Histogram (Number of Trials)
- **Trials per Move Count**:
- 1 move: 25 trials
- 2 moves: 30 trials
- 3 moves: 20 trials
- 4 moves: 15 trials
- 5 moves: 10 trials
- 6 moves: 5 trials
- 7 moves: 2 trials
- 8 moves: 1 trial
- 9 moves: 0.5 trials (anomaly: fractional value)
---
### Key Observations
1. **Abductive Agent**:
- A sharp drop in success rate at **4 moves** (20%) suggests a critical failure point.
- High success rates (100%) for 1–3 and 5–9 moves indicate robustness in most scenarios.
2. **Inductive Agent**:
- Near-perfect performance (100%) across all move counts except **1 move** (95%).
- Slight drop at 1 move may correlate with fewer trials (25 vs. 30 for 2 moves).
3. **Histogram Trends**:
- Trials decrease significantly with increasing move counts (e.g., 30 trials for 2 moves vs. 0.5 for 9 moves).
- The fractional value for 9 moves (0.5) is unusual and may indicate a data anomaly or rounding error.
---
### Interpretation
- **Performance Insights**:
- Inductive agents demonstrate **consistent high performance**, even with fewer trials, suggesting better generalization or adaptability.
- Abductive agents show **context-dependent failures**, particularly at 4 moves, which may reflect limitations in handling specific move sequences or insufficient training data for that scenario.
- **Trial Distribution**:
- The sharp decline in trials for higher move counts (e.g., 9 moves: 0.5 trials) raises questions about the feasibility or frequency of such scenarios in real-world applications.
- The inductive agent’s slight drop at 1 move (95%) despite 25 trials suggests that even with moderate trial counts, performance remains strong.
- **Anomalies**:
- The fractional trial count for 9 moves (0.5) is statistically unusual and may require validation.
- The overlapping color for 2 and 9 moves in the legend could cause confusion, though the data itself distinguishes them.
---
### Conclusion
The data highlights a clear distinction between the two agent types: inductive agents maintain near-perfect success rates across most scenarios, while abductive agents exhibit a critical failure at 4 moves. The trial distribution underscores the importance of balancing move complexity with available training data to ensure robust performance. Further investigation into the 4-move failure point for abductive agents and the fractional trial count for 9 moves is recommended.