## Bar Charts: Performance and Number of Trials
### Overview
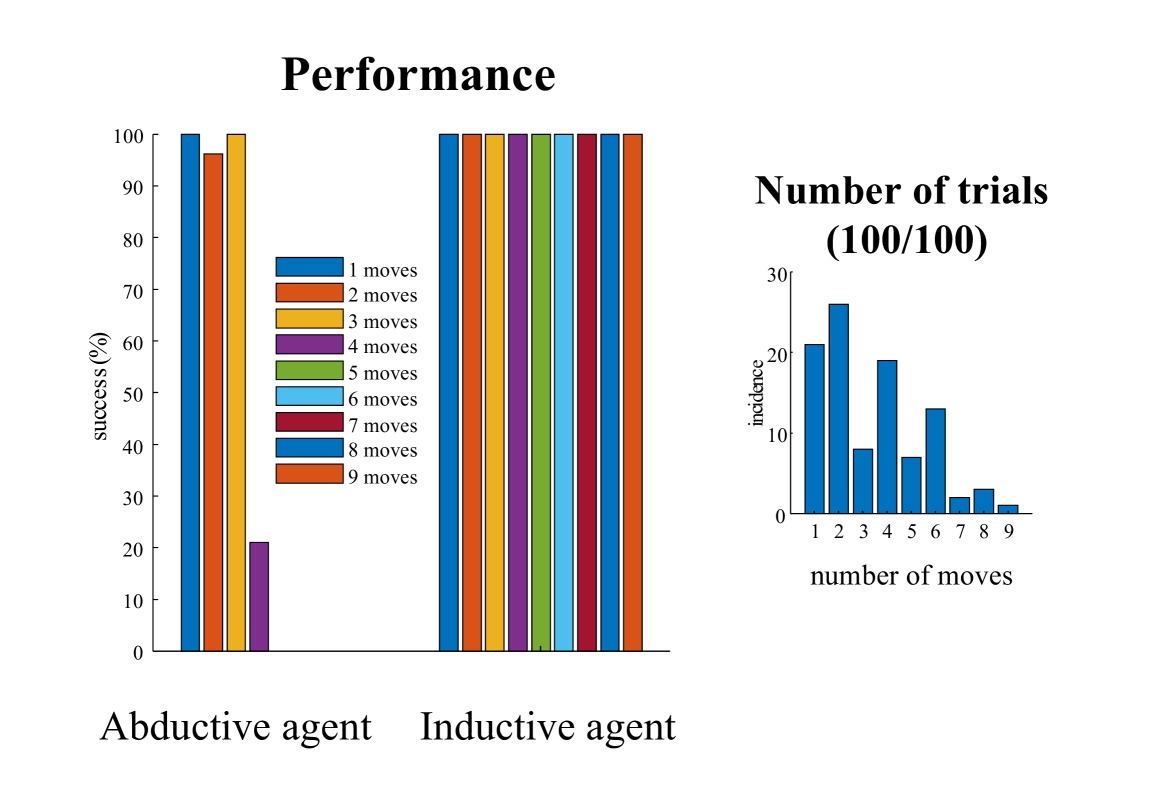
The image presents two bar charts. The first chart, titled "Performance," compares the success rate (%) of "Abductive agent" and "Inductive agent" across different numbers of moves (1 to 9). The second chart, titled "Number of trials (100/100)," shows the incidence of each number of moves.
### Components/Axes
**Performance Chart:**
* **Title:** Performance
* **Y-axis:** success (%)
* Scale: 0 to 100, with tick marks every 10 units.
* **X-axis:** Categorical, representing two agents: "Abductive agent" and "Inductive agent".
* **Legend:** Located on the top-left of the chart.
* 1 moves (Blue)
* 2 moves (Red)
* 3 moves (Yellow)
* 4 moves (Purple)
* 5 moves (Light Blue)
* 6 moves (Green)
* 7 moves (Dark Red)
* 8 moves (Dark Blue)
* 9 moves (Orange)
**Number of Trials Chart:**
* **Title:** Number of trials (100/100)
* **Y-axis:** incidence
* Scale: 0 to 30, with no explicit tick marks.
* **X-axis:** number of moves
* Categories: 1 to 9
### Detailed Analysis
**Performance Chart:**
* **Abductive Agent:**
* 1 move (Blue): Approximately 98% success.
* 2 moves (Red): Approximately 96% success.
* 3 moves (Yellow): Approximately 99% success.
* 4 moves (Purple): Approximately 21% success.
* **Inductive Agent:**
* 1 move (Blue): 100% success.
* 2 moves (Red): 100% success.
* 3 moves (Yellow): 100% success.
* 4 moves (Purple): 100% success.
* 5 moves (Light Blue): 100% success.
* 6 moves (Green): 100% success.
* 7 moves (Dark Red): 100% success.
* 8 moves (Dark Blue): 100% success.
* 9 moves (Orange): 100% success.
**Number of Trials Chart:**
* 1 move: Approximately 21 incidence.
* 2 moves: Approximately 26 incidence.
* 3 moves: Approximately 8 incidence.
* 4 moves: Approximately 19 incidence.
* 5 moves: Approximately 7 incidence.
* 6 moves: Approximately 13 incidence.
* 7 moves: Approximately 2 incidence.
* 8 moves: Approximately 3 incidence.
* 9 moves: Approximately 1 incidence.
### Key Observations
* The Inductive agent achieves 100% success across all move counts.
* The Abductive agent has high success rates for 1-3 moves, but a significantly lower success rate for 4 moves.
* The number of trials is highest for 2 moves, followed by 1 and 4 moves, and decreases as the number of moves increases.
### Interpretation
The "Performance" chart indicates that the Inductive agent is significantly more successful than the Abductive agent, especially when more moves are required. The Abductive agent's performance drops drastically at 4 moves, suggesting a limitation in its strategy or learning process. The "Number of trials" chart shows the distribution of moves required, with fewer trials needed as the number of moves increases, which could be due to the increasing complexity or difficulty of the task. The combination of these two charts suggests that while the Inductive agent consistently solves the task, the Abductive agent struggles with more complex scenarios.