## Radar Chart: Olympiabench
### Overview
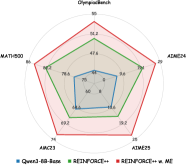
The image is a radar chart comparing the performance of three models (Qwen3-8B-Base, REINFORCE++, and REINFORCE++ w. ME) across five different benchmarks: Olympiabench, AIME24, AIME25, AMC23, and MATH500. The chart displays the performance of each model as a percentage score on each benchmark.
### Components/Axes
* **Title:** Olympiabench
* **Axes:** The chart has five axes, each representing a different benchmark. The axes are labeled as follows:
* Top: Olympiabench
* Top-Right: AIME24
* Bottom-Right: AIME25
* Bottom-Left: AMC23
* Top-Left: MATH500
* **Scale:** The radial scale ranges from 0 to 100, with intermediate values marked.
* **Legend:** Located at the bottom of the chart.
* Blue: Qwen3-8B-Base
* Green: REINFORCE++
* Red: REINFORCE++ w. ME
### Detailed Analysis
The chart displays the performance of each model on each benchmark. The values are approximate due to the resolution of the image.
* **Qwen3-8B-Base (Blue):**
* Olympiabench: ~62%
* AIME24: ~9.6%
* AIME25: ~15.6%
* AMC23: ~45.6%
* MATH500: ~78.6%
* **REINFORCE++ (Green):**
* Olympiabench: ~47.6%
* AIME24: ~79%
* AIME25: ~19.2%
* AMC23: ~69.2%
* MATH500: ~64.2%
* **REINFORCE++ w. ME (Red):**
* Olympiabench: ~54.2%
* AIME24: ~79%
* AIME25: ~26%
* AMC23: ~74%
* MATH500: ~86%
### Key Observations
* REINFORCE++ w. ME (Red) generally outperforms the other two models, especially on MATH500 and AMC23.
* Qwen3-8B-Base (Blue) performs well on MATH500 but poorly on AIME24 and AIME25.
* REINFORCE++ (Green) shows a balanced performance across all benchmarks, with a notable performance on AIME24.
* All models struggle on AIME25, with scores below 30%.
### Interpretation
The radar chart provides a visual comparison of the performance of three models across five different benchmarks. The data suggests that REINFORCE++ w. ME is the most effective model overall, particularly on MATH500 and AMC23. Qwen3-8B-Base shows strong performance on MATH500 but struggles on AIME24 and AIME25. REINFORCE++ offers a more balanced performance across all benchmarks. The low scores on AIME25 for all models indicate that this benchmark may be particularly challenging. The chart highlights the strengths and weaknesses of each model, allowing for a more informed decision when selecting a model for a specific task.